Data dashboards are ubiquitous in modern days. From the weather app we daily use to the giant flight information board at the airport, various data is presented to the audience through the eyes of the design. Because the information hierarchy defined by the design determines the narrative of the data, the designer plays an essential role in organizing data visualizations that conveys cohesive narrative that fits to the user's goal.
Ashley Kim
Mia Hofmann
Vikitha Reddy Bezawada
Ziwen Zeng
UI/UX design
persona development
pitch presentation
Oct 12 - Nov 4, 2021
(3 weeks)
Challenges
How can we design a dashboard that can be easily used by two user groups with different goals?
How do we use the dashboard as the communication tool between the two user groups so that it generates greater work efficiency within the company?
Designing a dashboard that's closely customized for the target users may be easily done, as all the goals would head towards the same direction. However, designing a dashboard for two target user groups may be more challenging, as a feature that's beneficial to one target user may not be useful at all to the other. In addition, the environment the users may be using the dashboard in should also be considered to design a dashboard that's
comfortable to use for both. Once the design serves the individual goals of the two groups, we then have to think about
how the two user groups can cooperate through our dashboard to further contribute to the growth of the company.
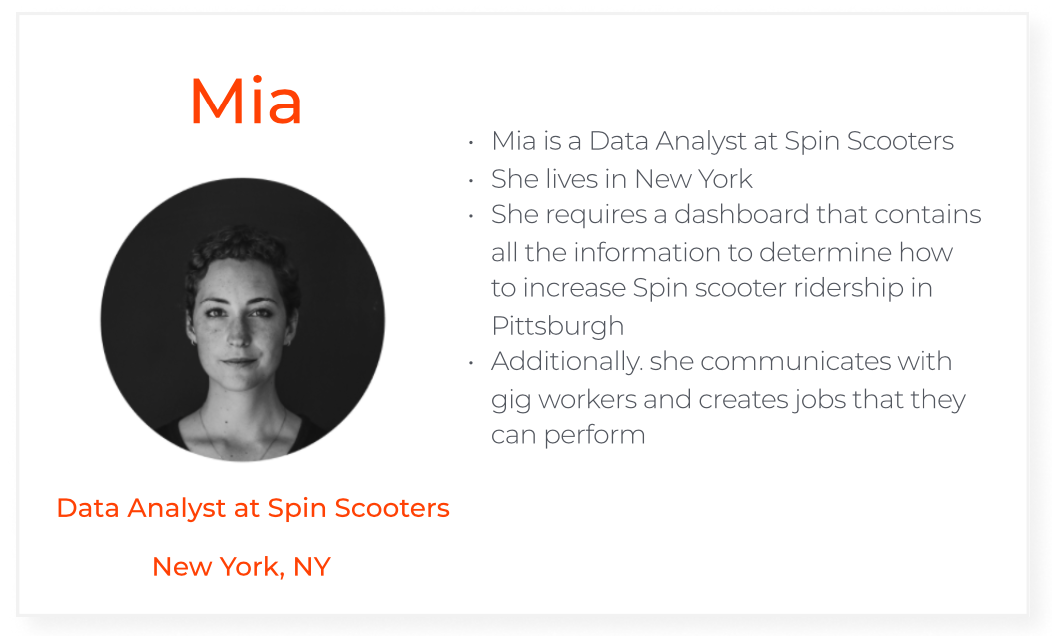
Our dashboard should serve both data analysts and gig workers at Spin Scooters. Because the design that helps both user groups cannot be made without knowing about our users in depth, we first defined personas for each group and analyzed their needs and pain points.
Process
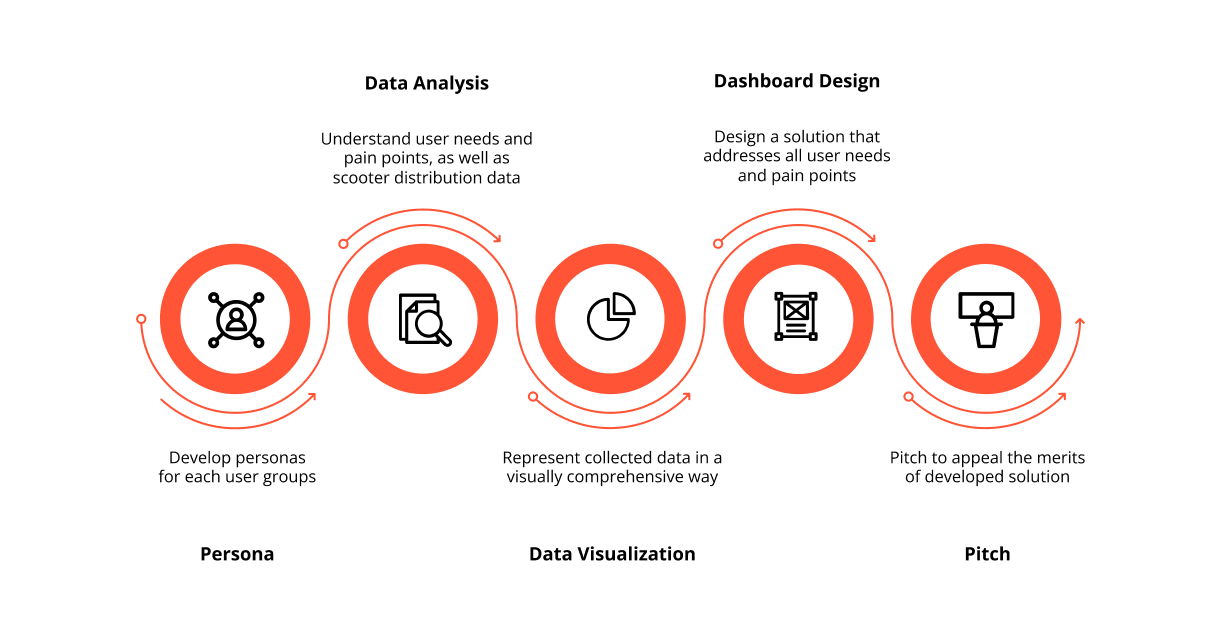
Personas
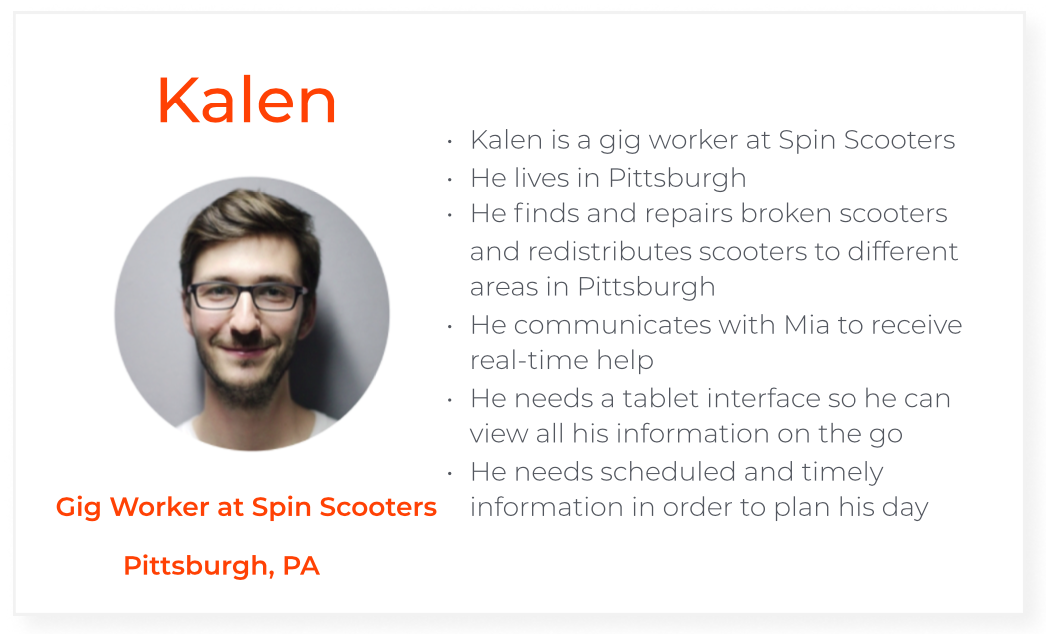
We first defined the two personas, Mia the data analyst and Kalen the gig worker. The following cards define their background and the goals they need to achieve at Spin Scooters. These simple personas containing the main stakeholder needs and pain points will serve as the underlying guides throughout our design process.
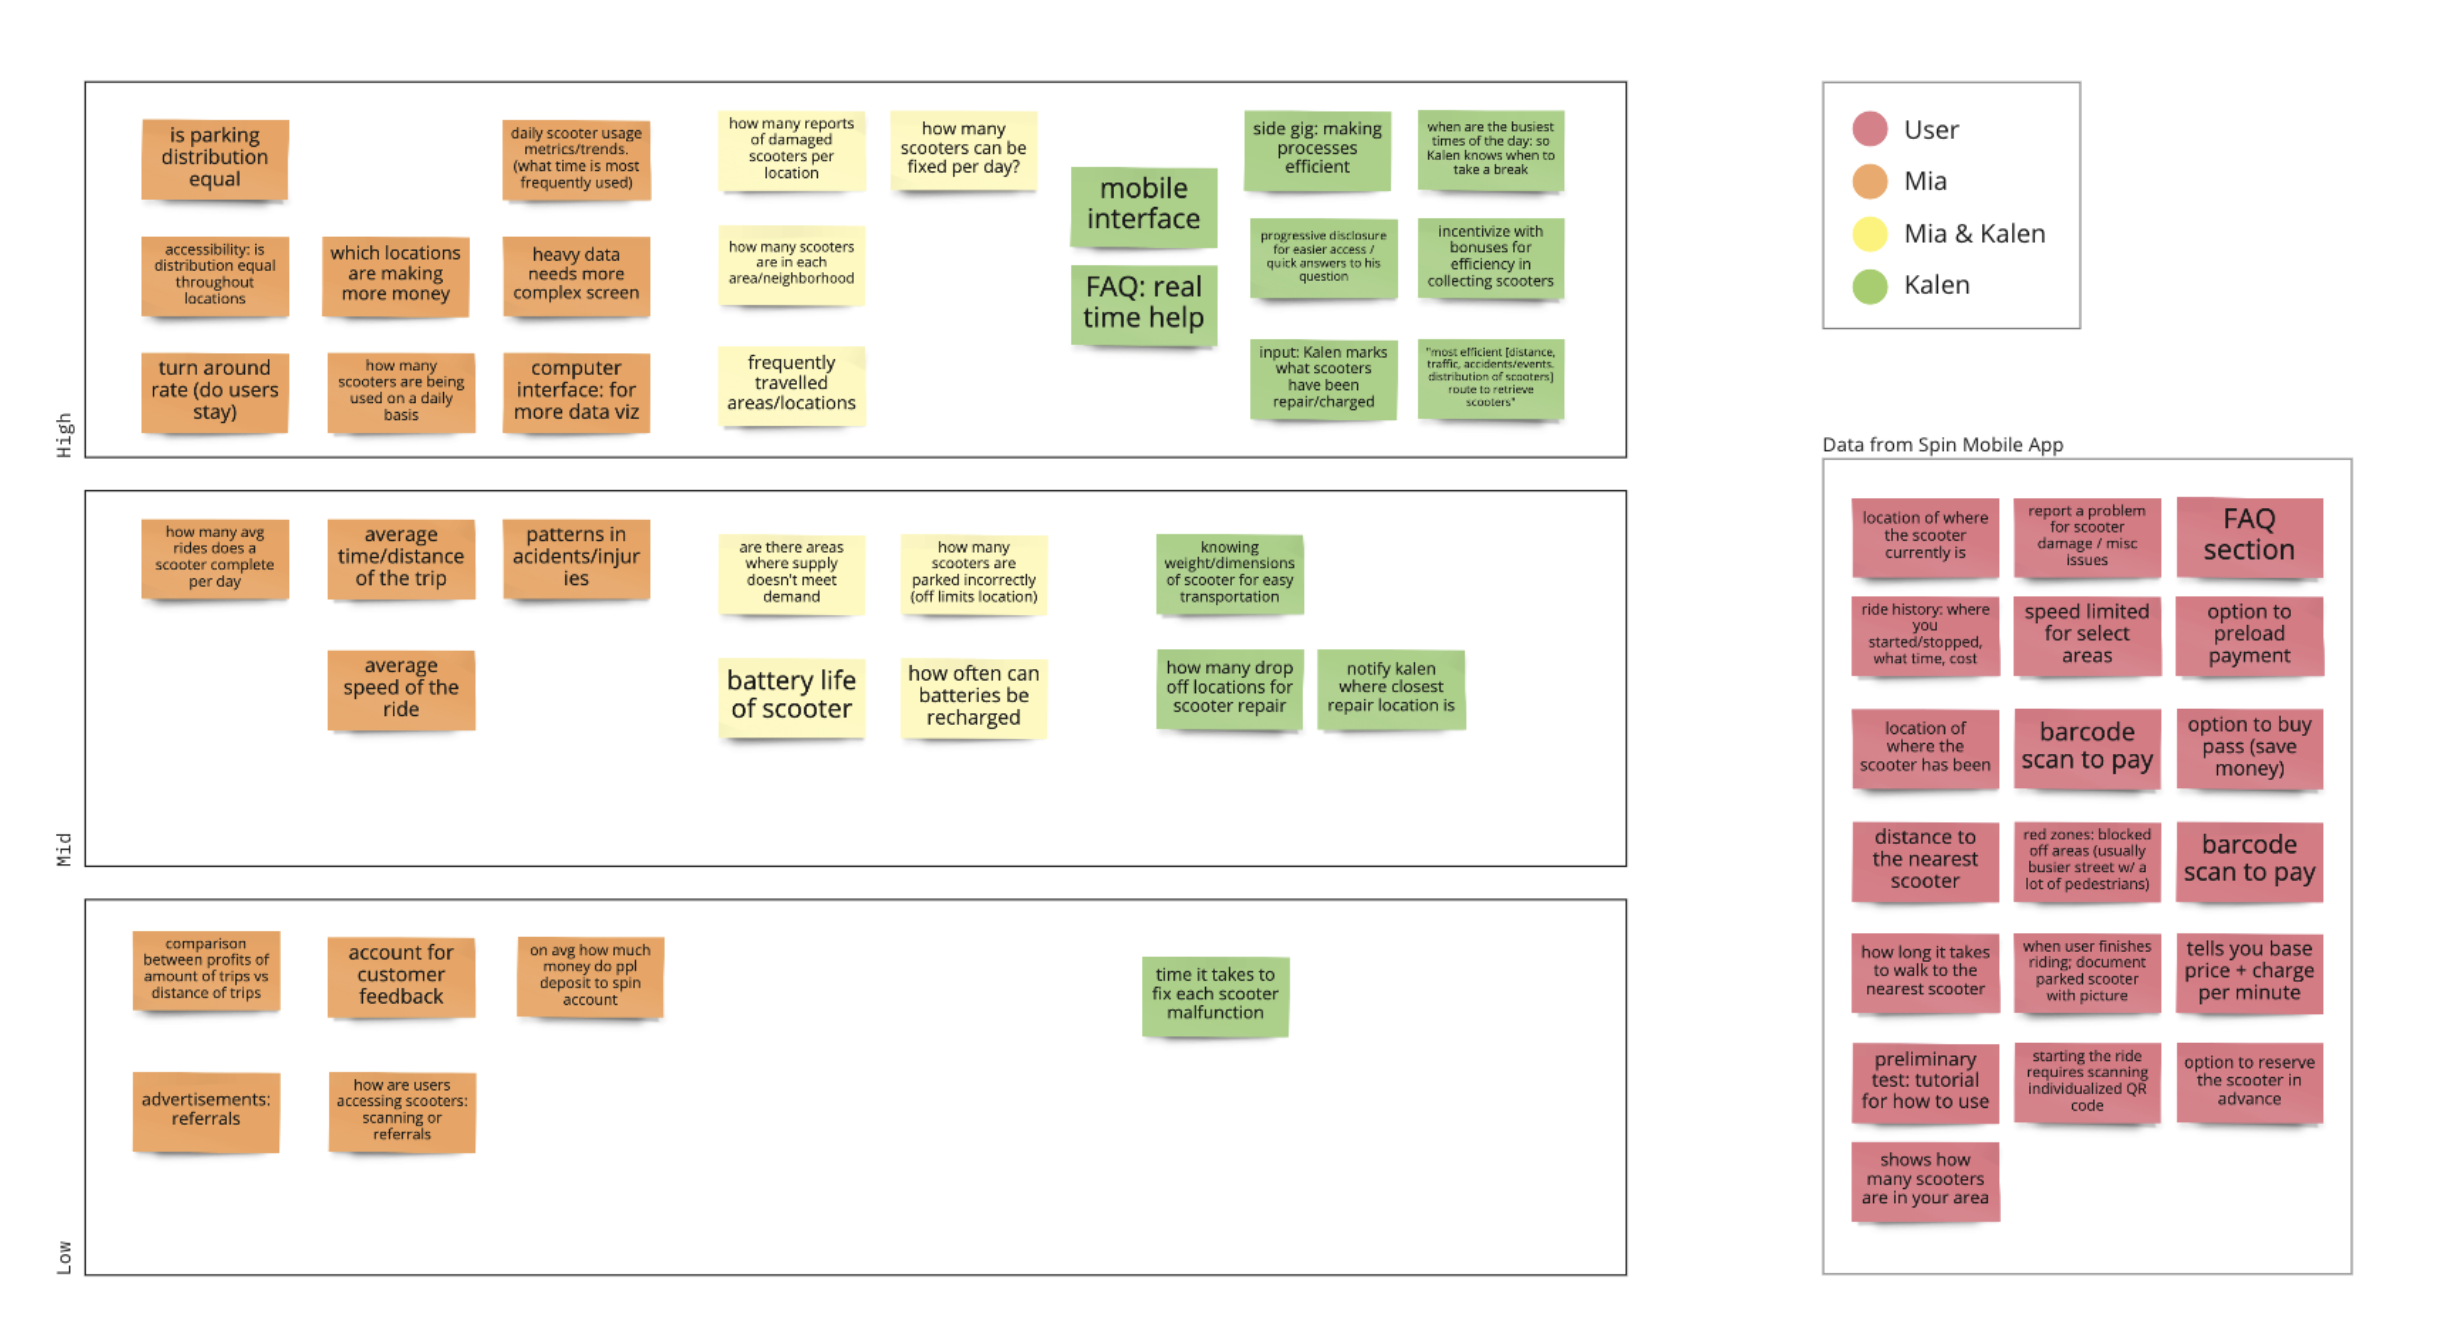
Analyzing Data
Based on the persona analysis, we started by creating an affinity diagram that includes all stakeholder's needs. We categorized these from low to high priority to help us identify the most important data to be displayed on the dashboard. Through this process, we aimed to capture the types of thick and big data we would need in designing the dashboard.
Synthesizing Data
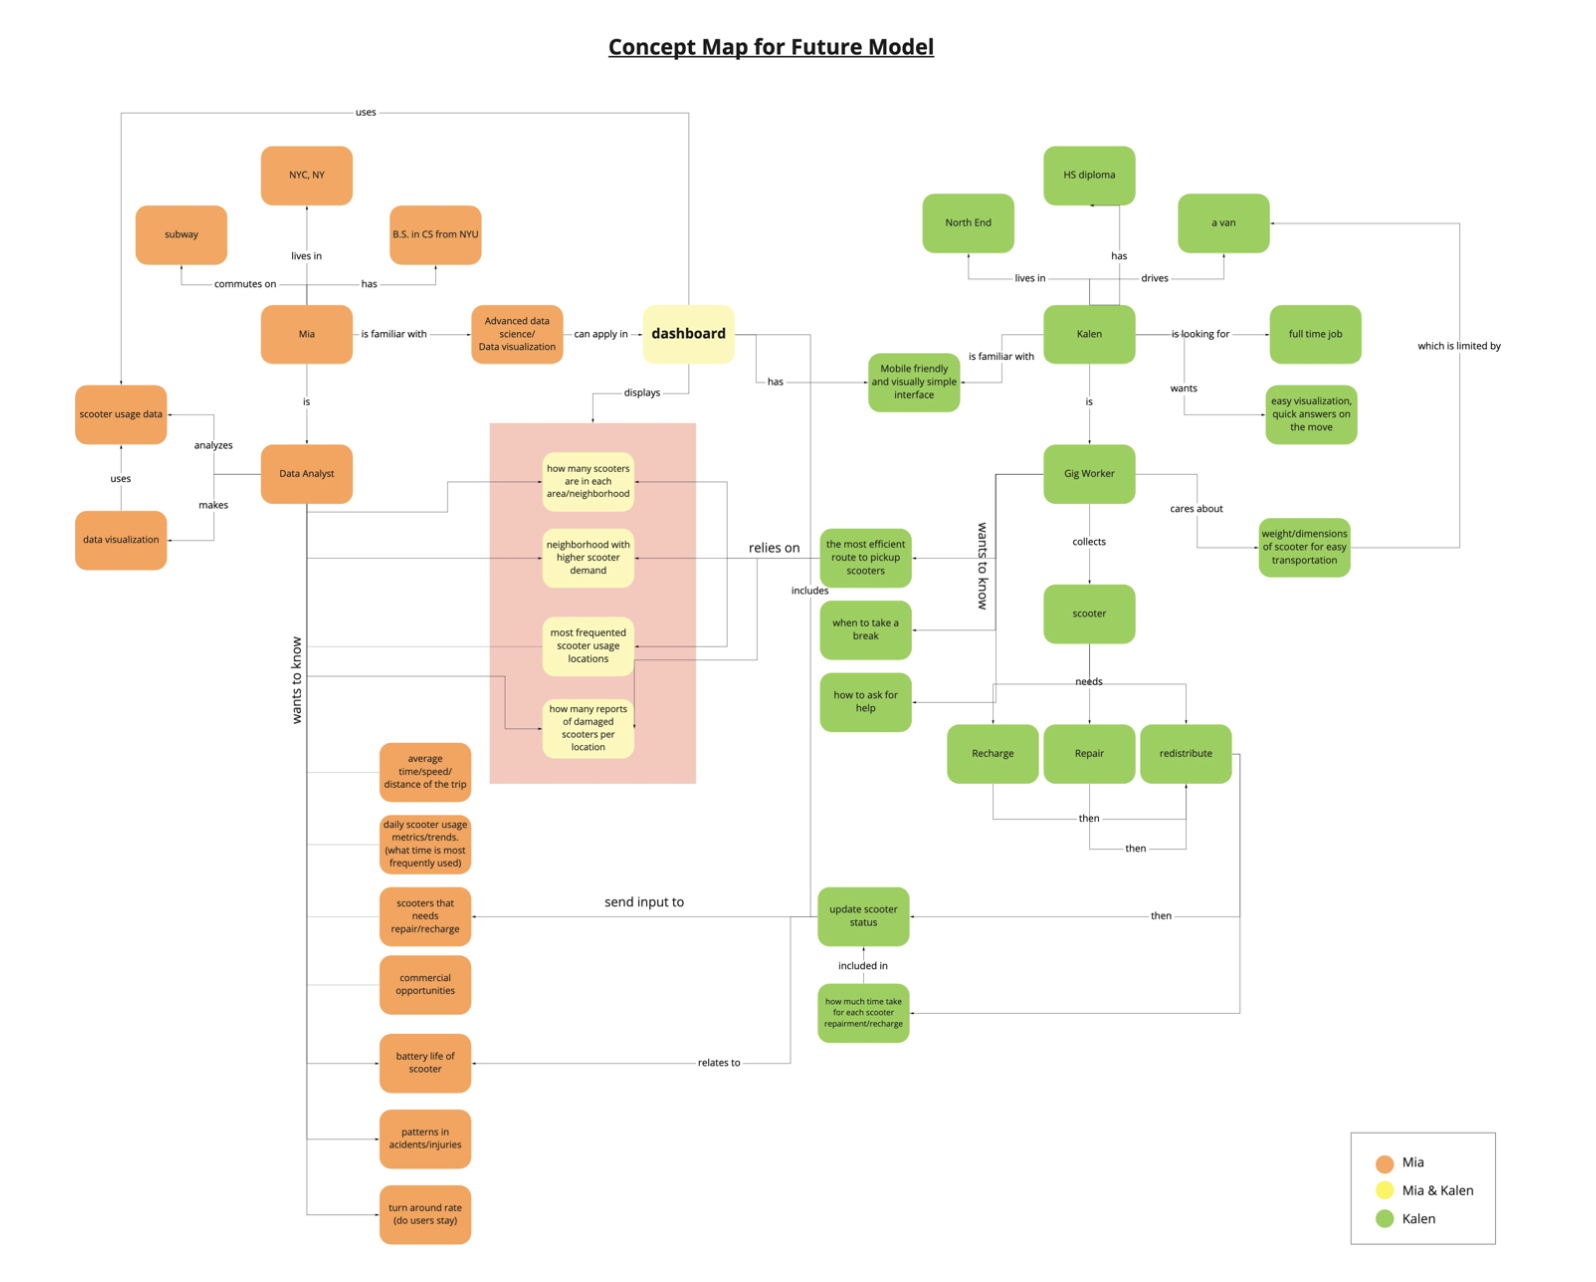
Data can be used to reveal patterns and recognize themes. In order to clearly map out the findings from the affinity diagram, we created the following concept map for the current model. It pays a great attention to Mia and Karen's needs, behaviors, and actions at each touchpoint.
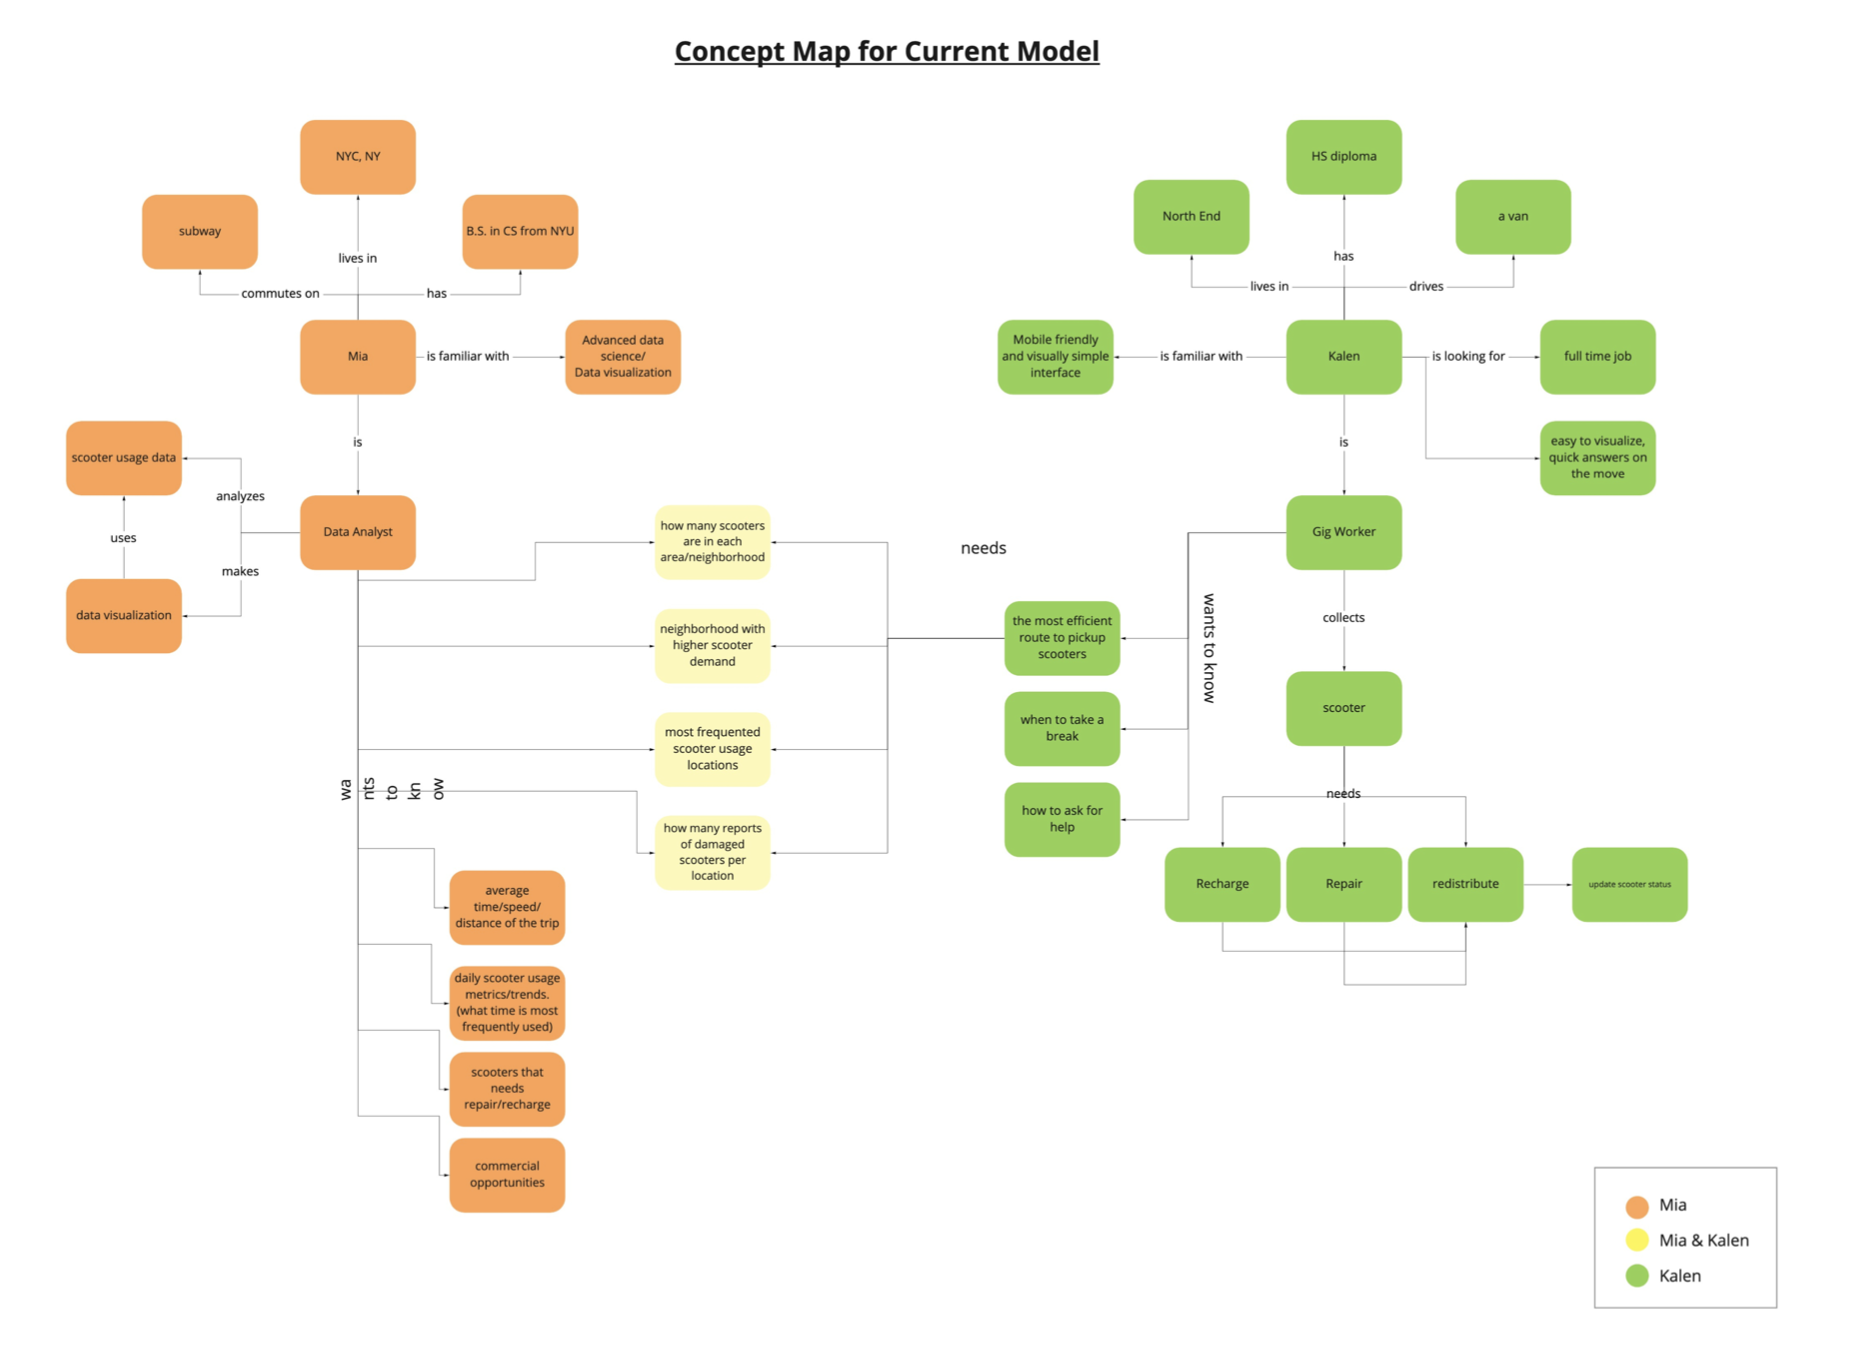
We then identified the overlapping needs between the two personas and indicated them in our future state model. Since we're designing a dashboard for the two personas to both achieve their goals while also communicating with each other to enhance the productivity, our future state model highlights the features the dashboard should provide to solve our main challenges.
Low-fidelity Ideation Sketches
Based on our initial research and persona relation development, each of the team member came up with own ideation sketches that shows both the layout of the dashboard as well as each individual features.
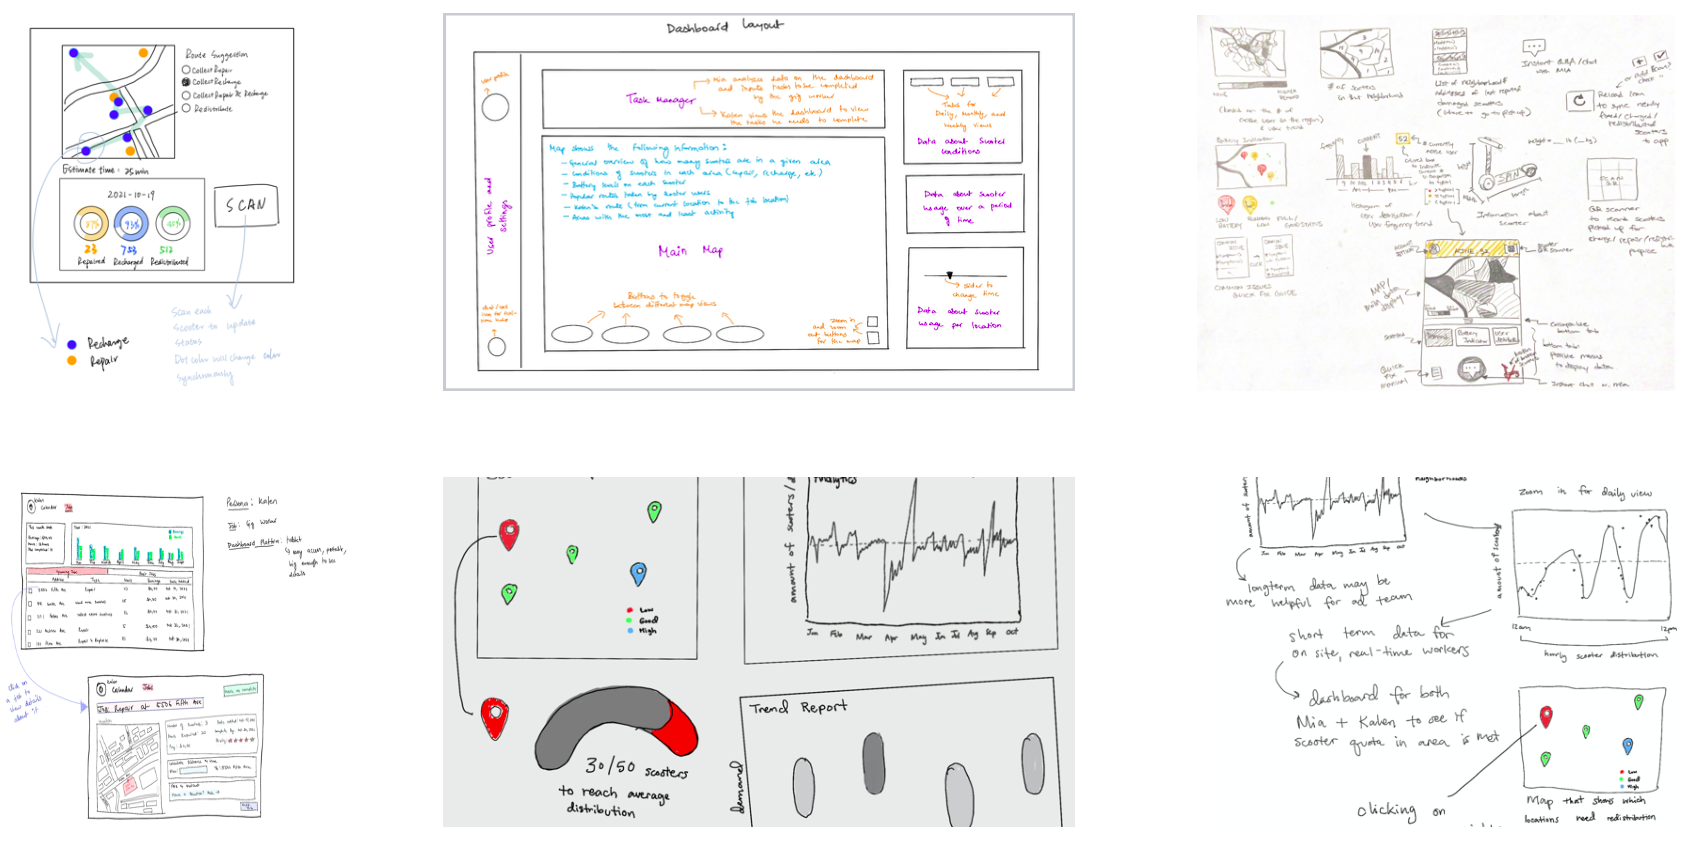
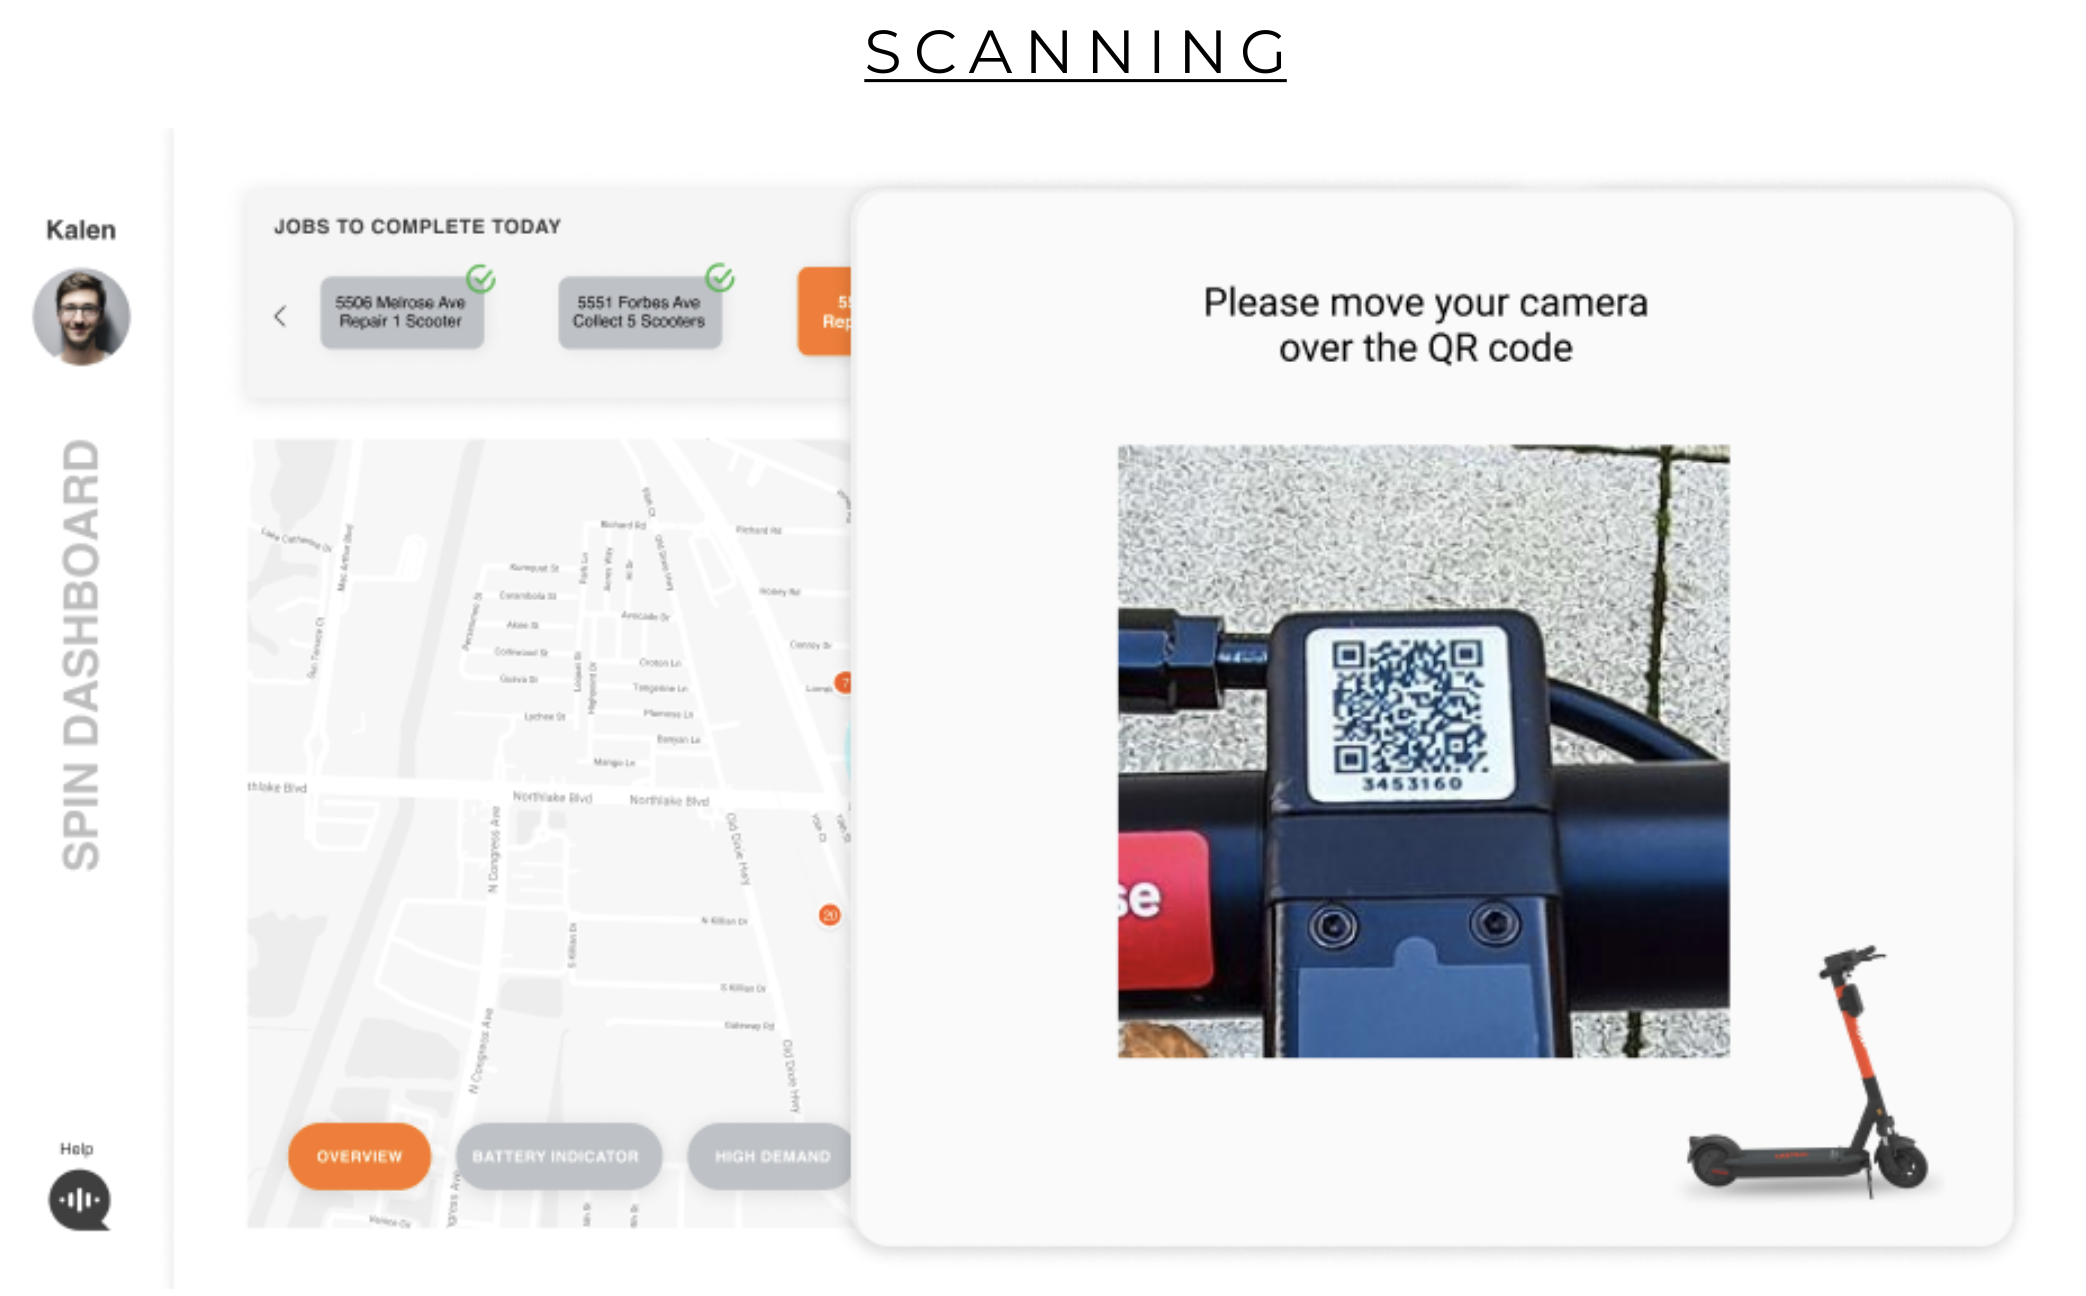
Thinking that the scooter location data on a map and the battery indicator for each scooter would be essential data to show, I mainly ideated the multiple map features like the battery indicator map and the scooter status update features like the QR code scanner.
Style Guide
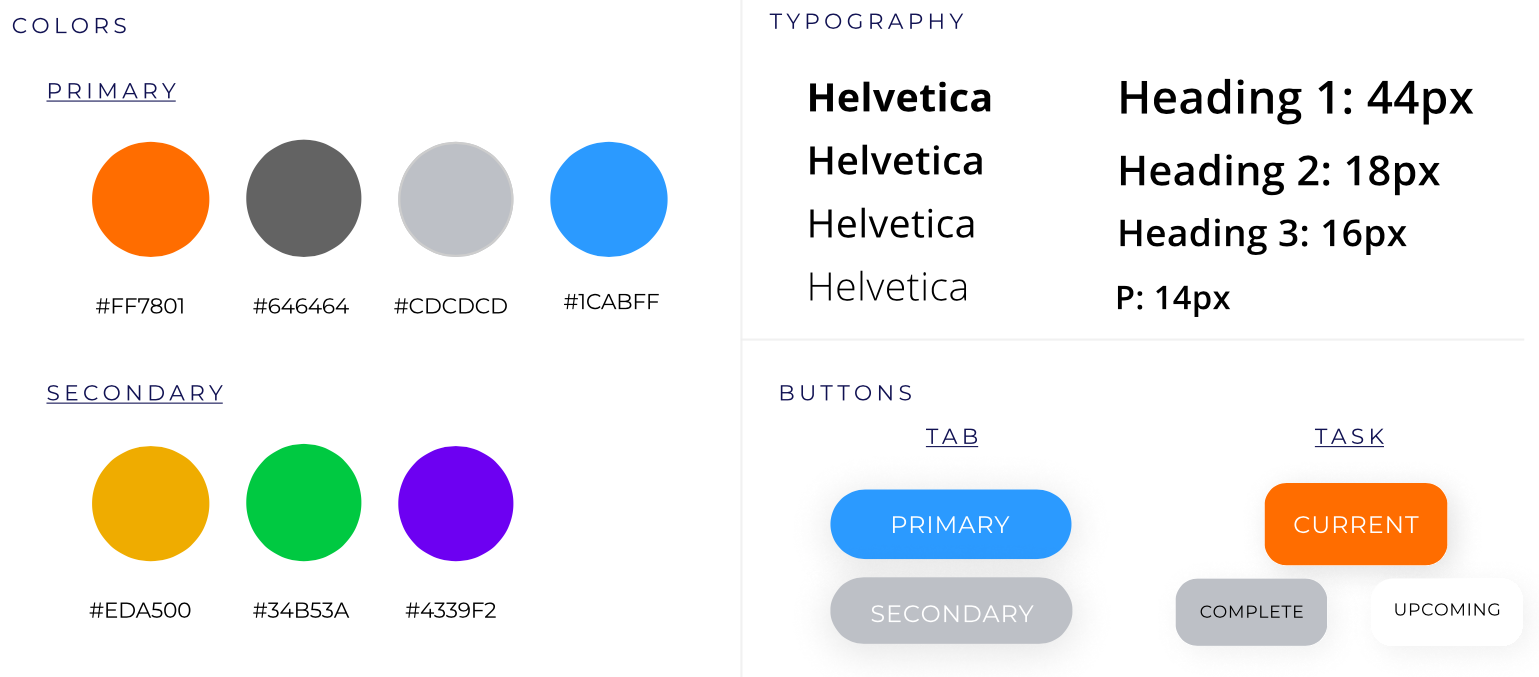
As we move on to the mid-fidelity prototypes, we first defined our dashboard's style guide to keep our dashboard design consistent and structured. We referred to the Spin Scooter's official colors and style guide when establishing our own. This was to keep the Spin Scooters' brand identity consistent, as the users are the employees of the Spin Scooters.
Mid-fidelity Prototype
Layout
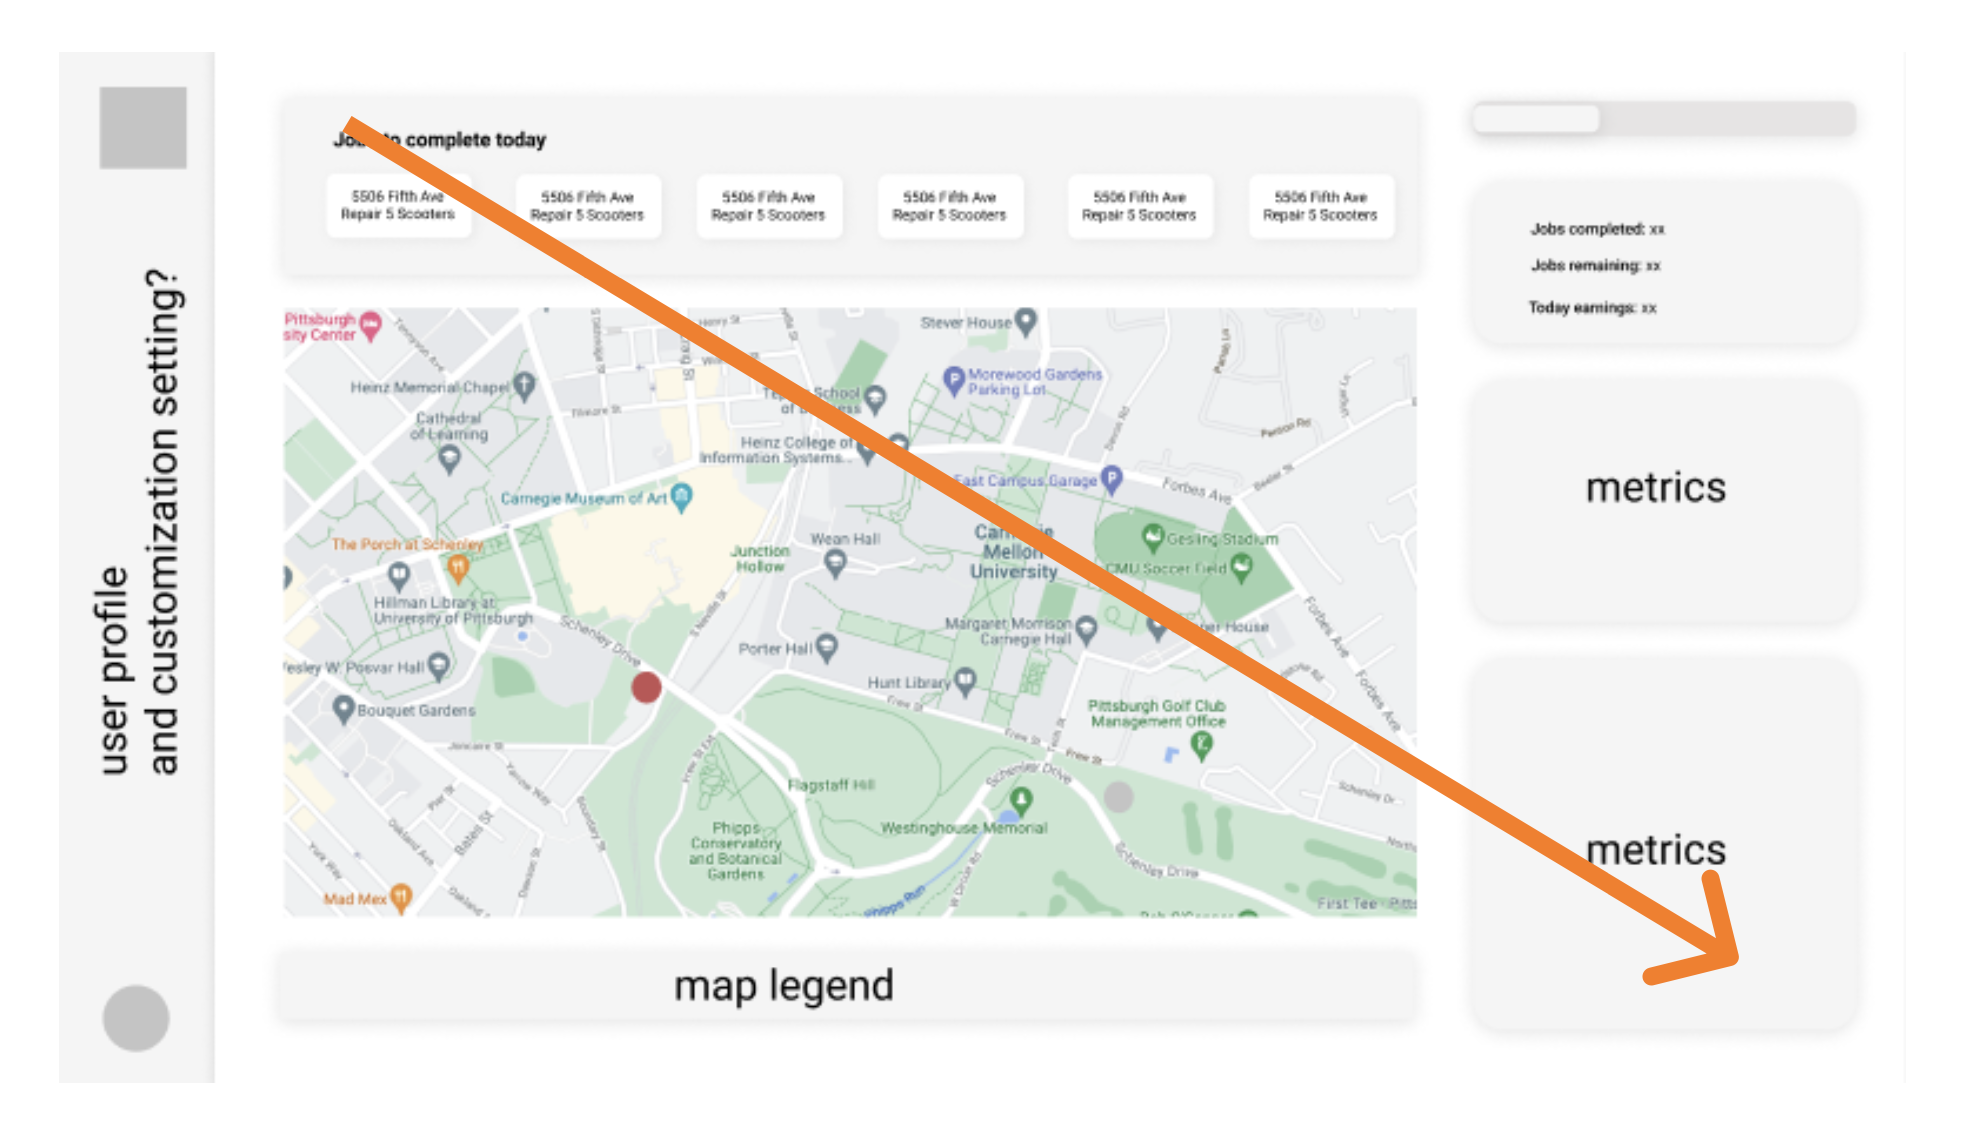
Since people typically read from top left to bottom right, we decided to follow this structure in prioritizing the elements and guiding the user's view. Hence, we located the current scooter status on the left and other data like historical rider data on the right.
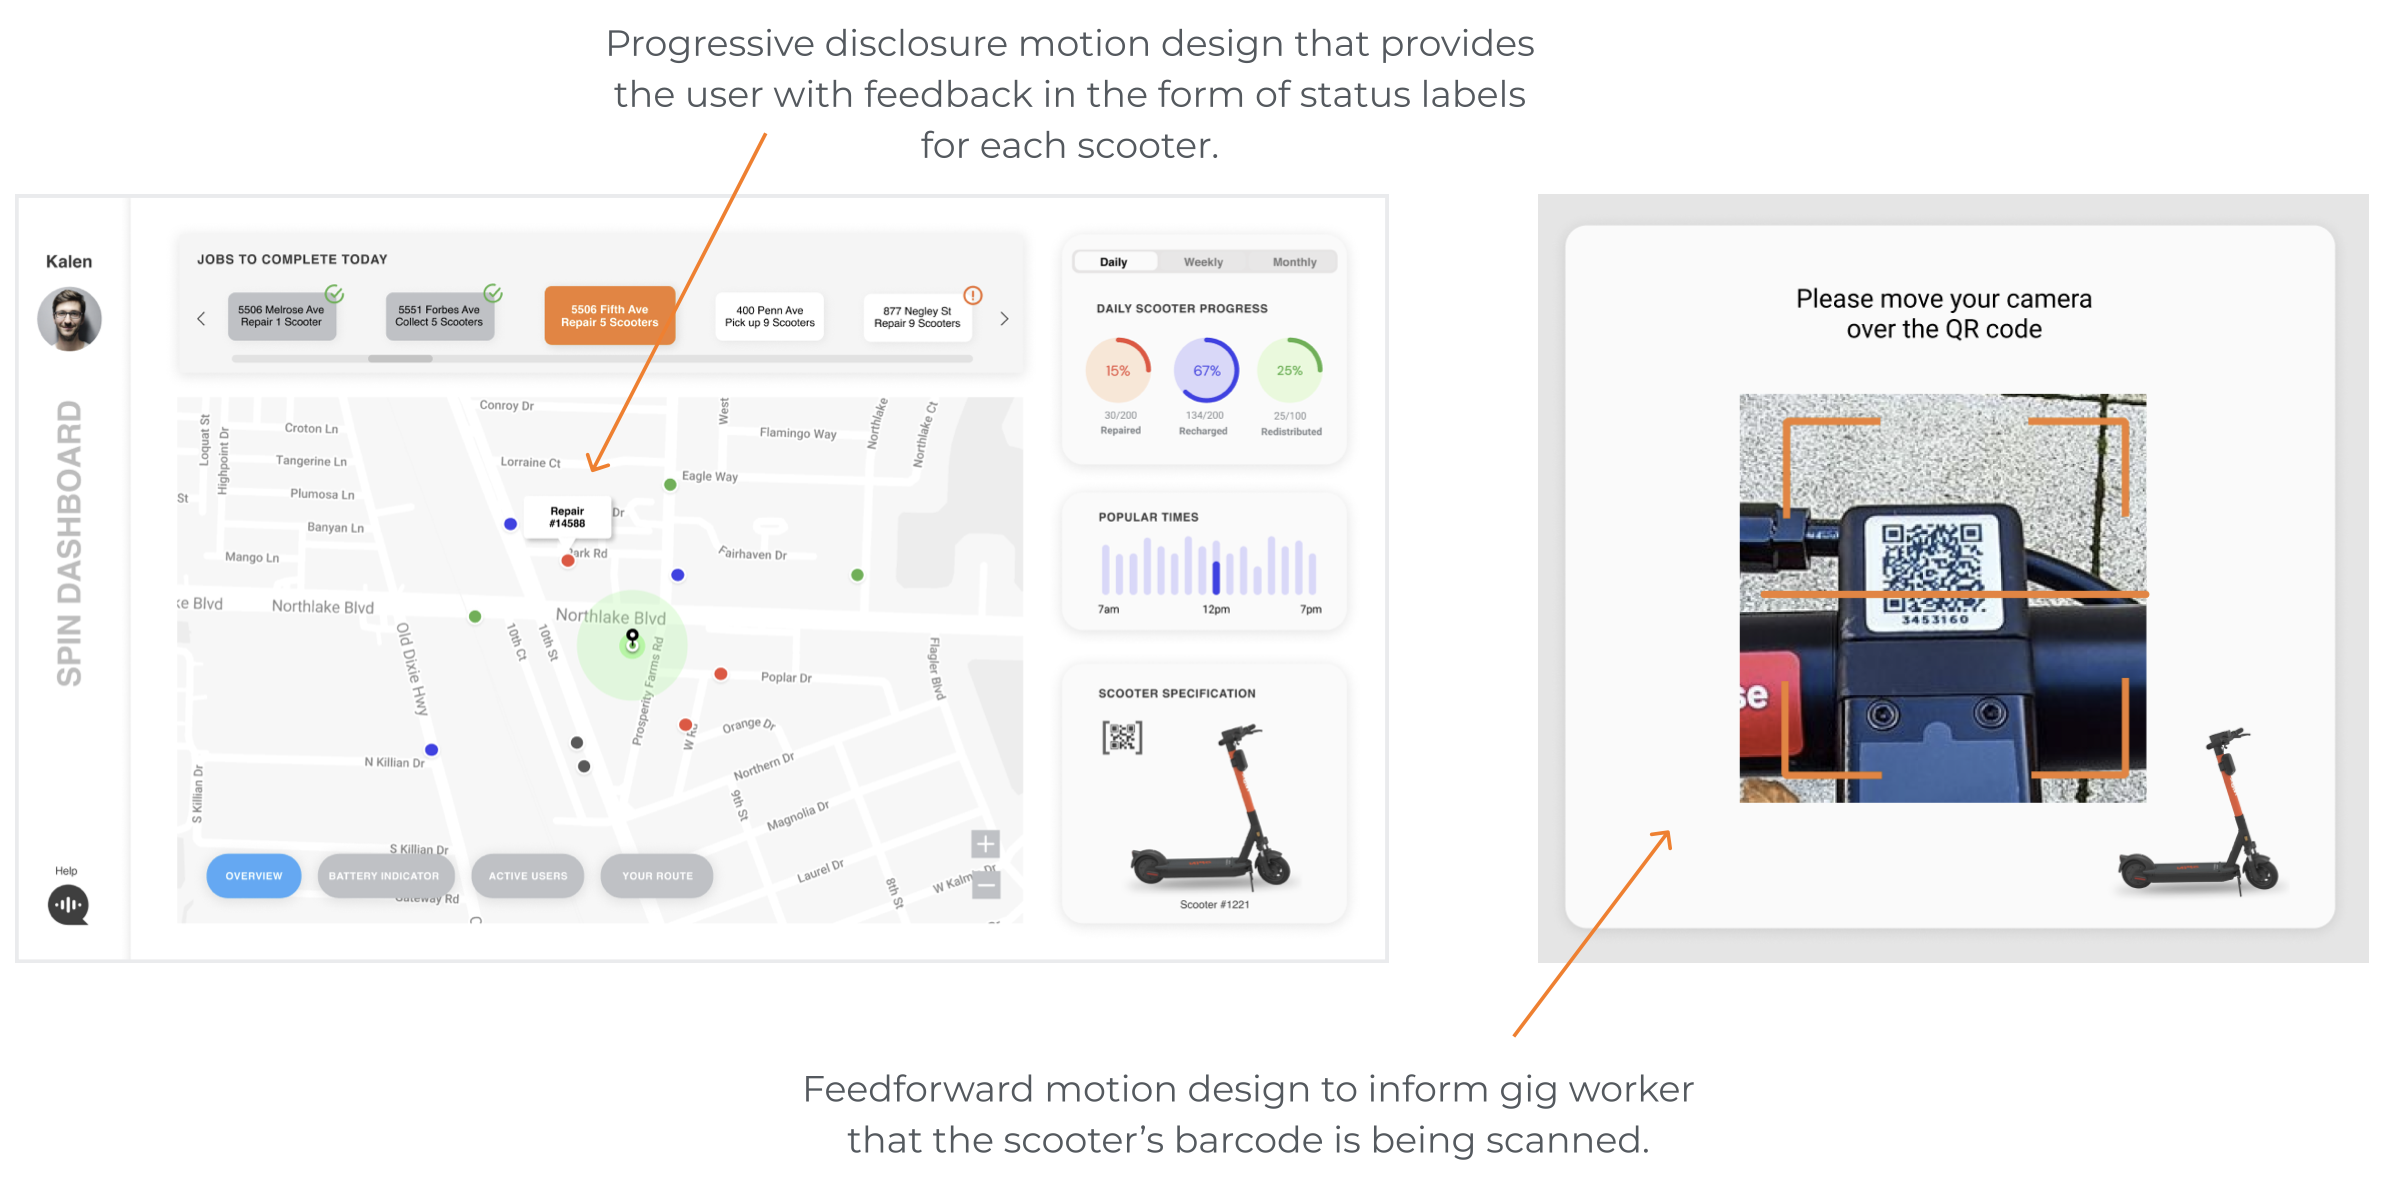
According to the principles of progressive disclosure, high priority elements should be able to grab immediate attention on a layout.
Therefore, we allocated the majority of the dashboard space to our most essential data display, the map feature. The larger size of the map also helps the user to decipher details more easily, which are critical to both of our personas, Mia the data analyst and Kalen the gig worker.
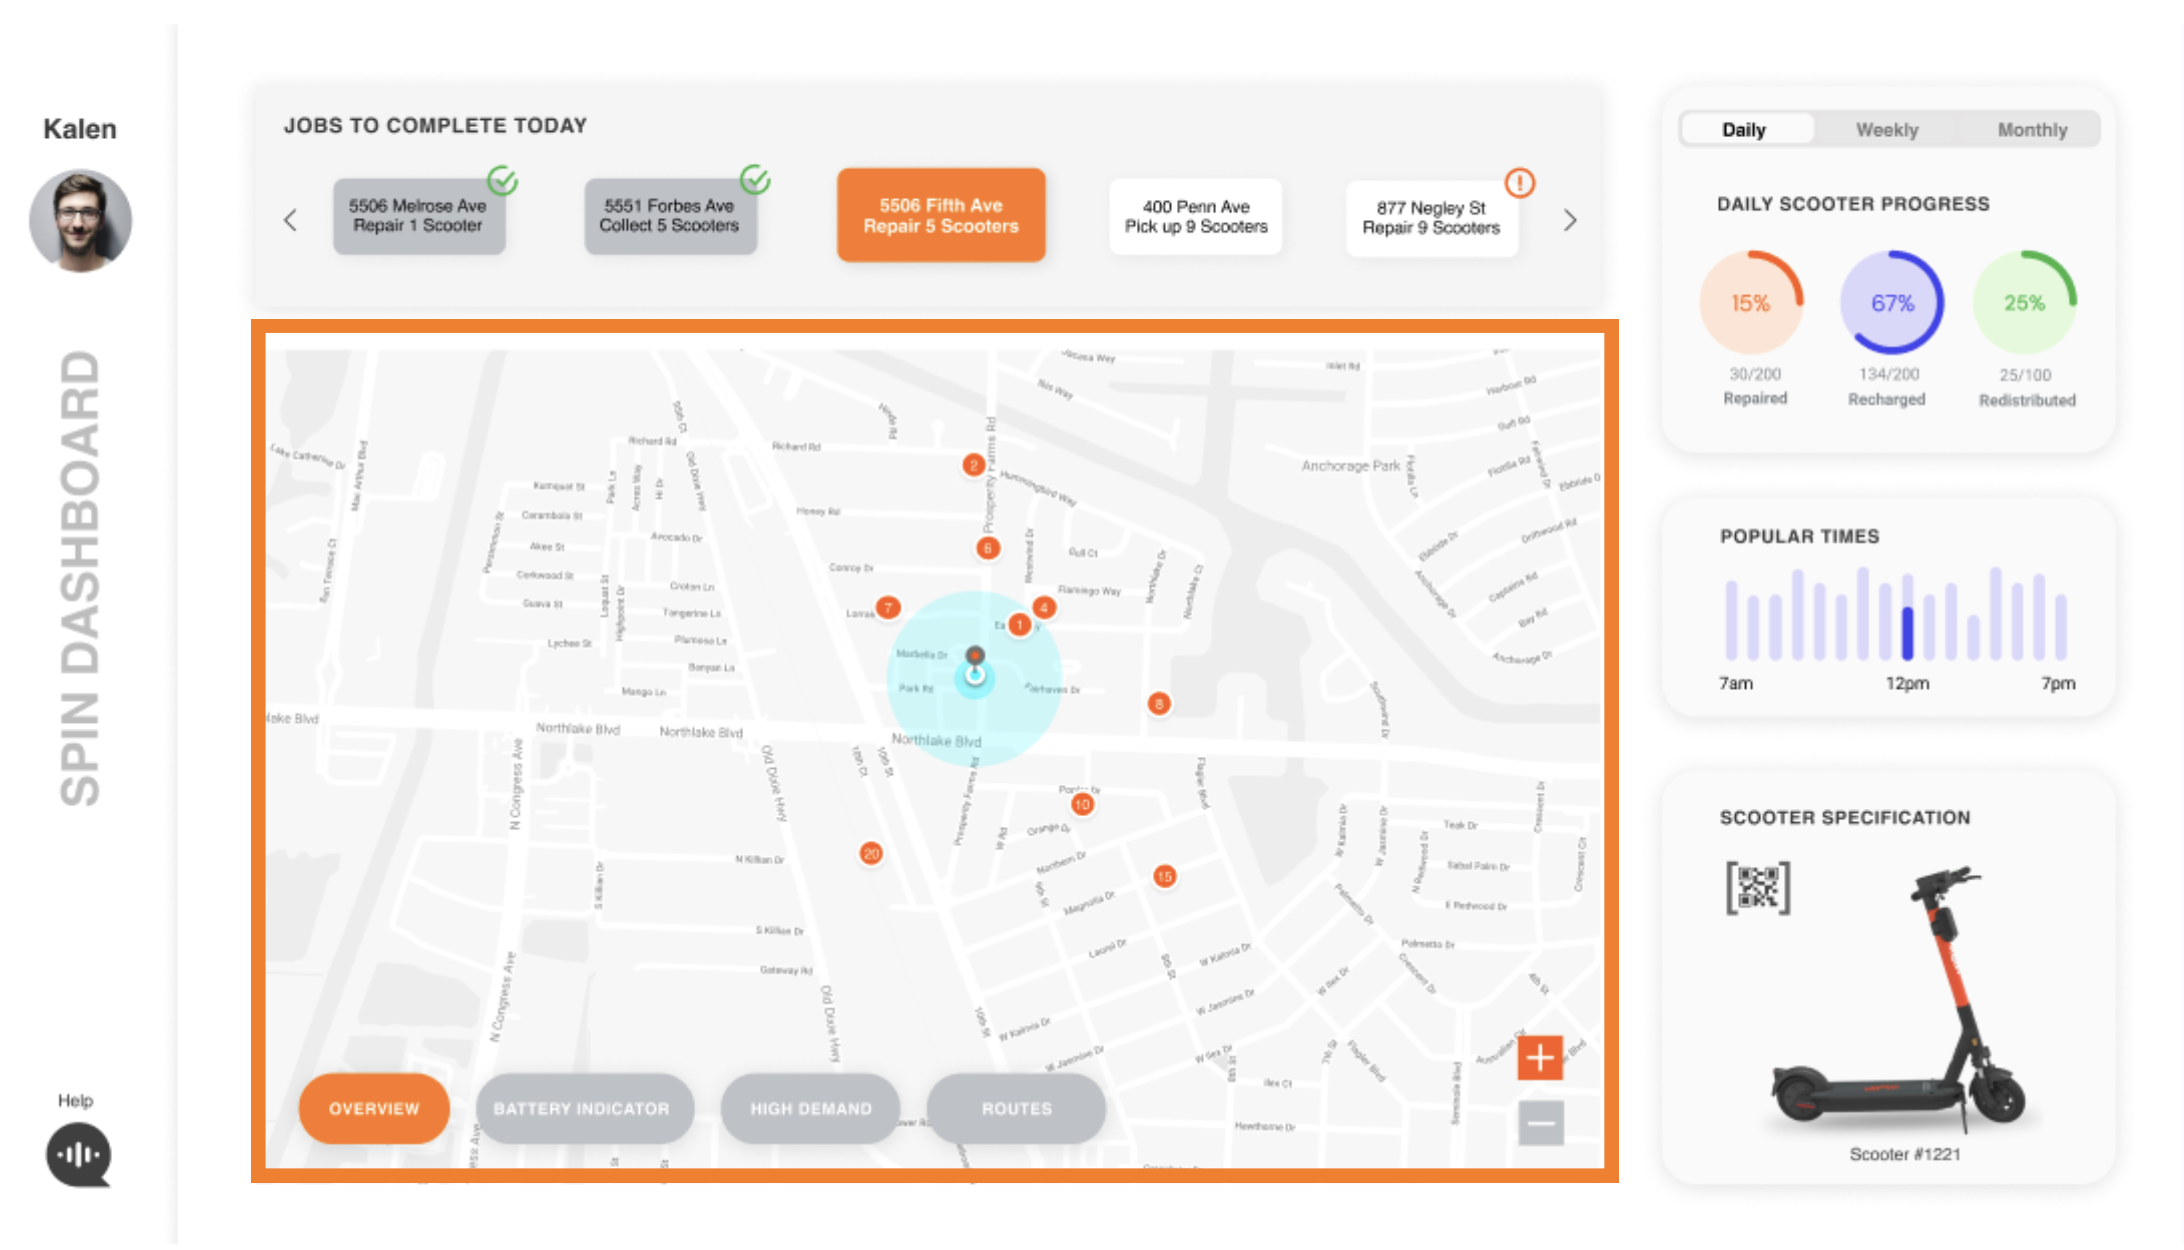
Utilizing the grid structure to maintain the cohesive organization, we decided to show various metrics and trends based on the past scooter usage data on the right panel since this data is intended to supplement the data displayed on the map. All the supplementary data is coupled together, allowing the users to quickly make a reference or compare across metrics.
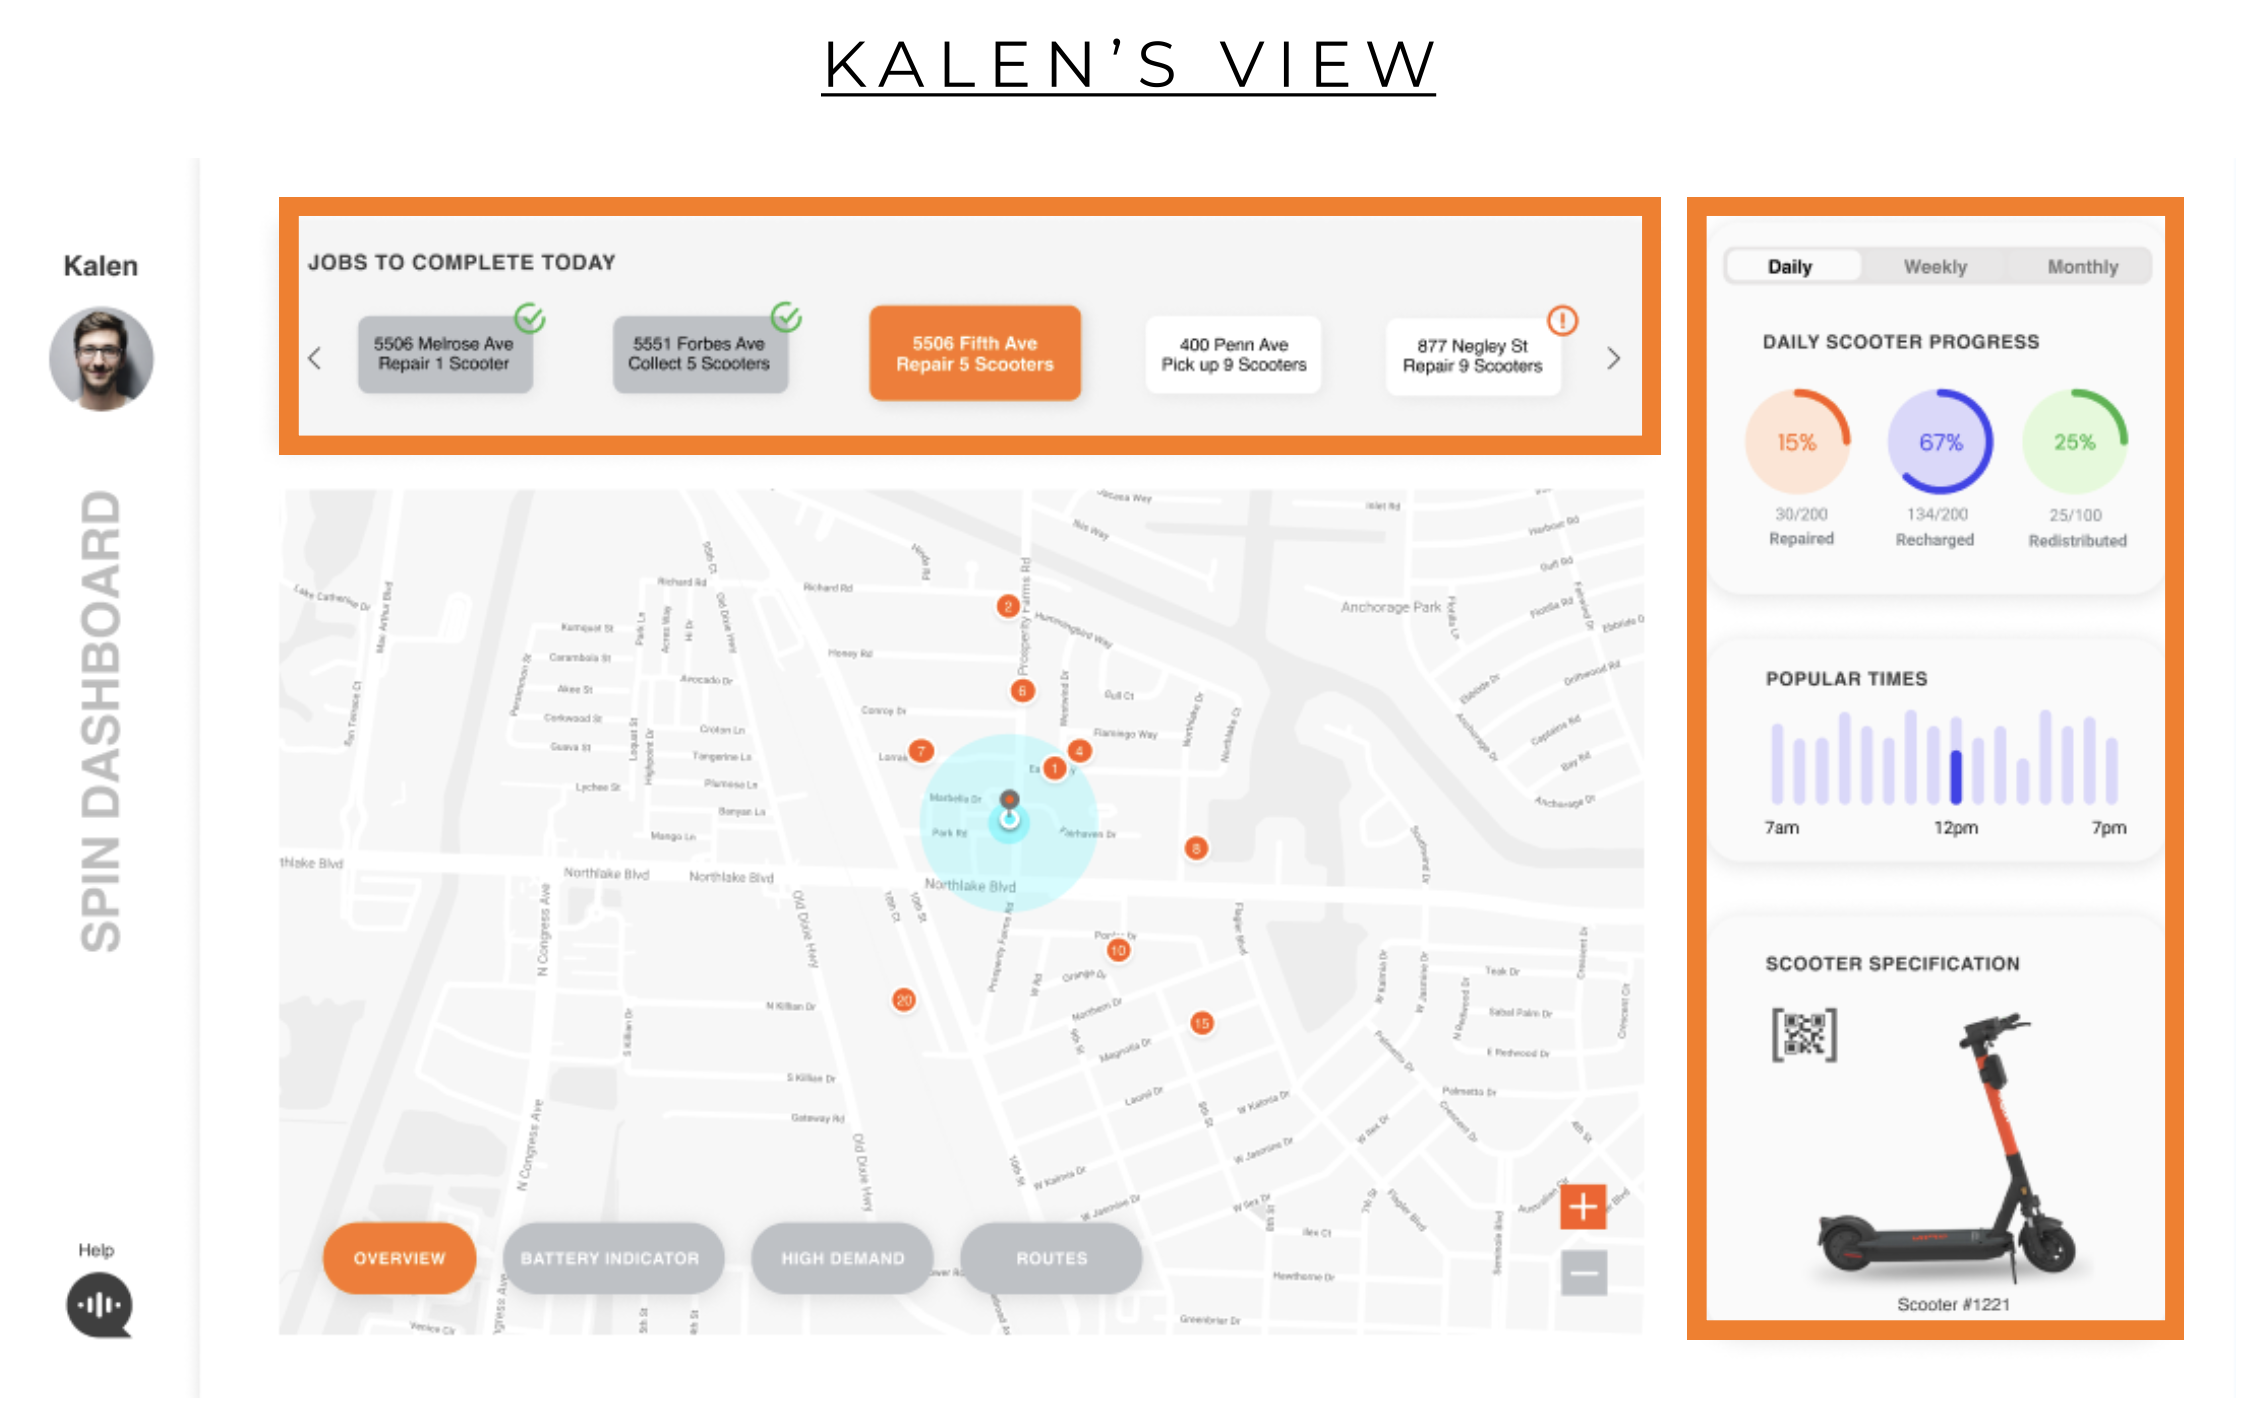
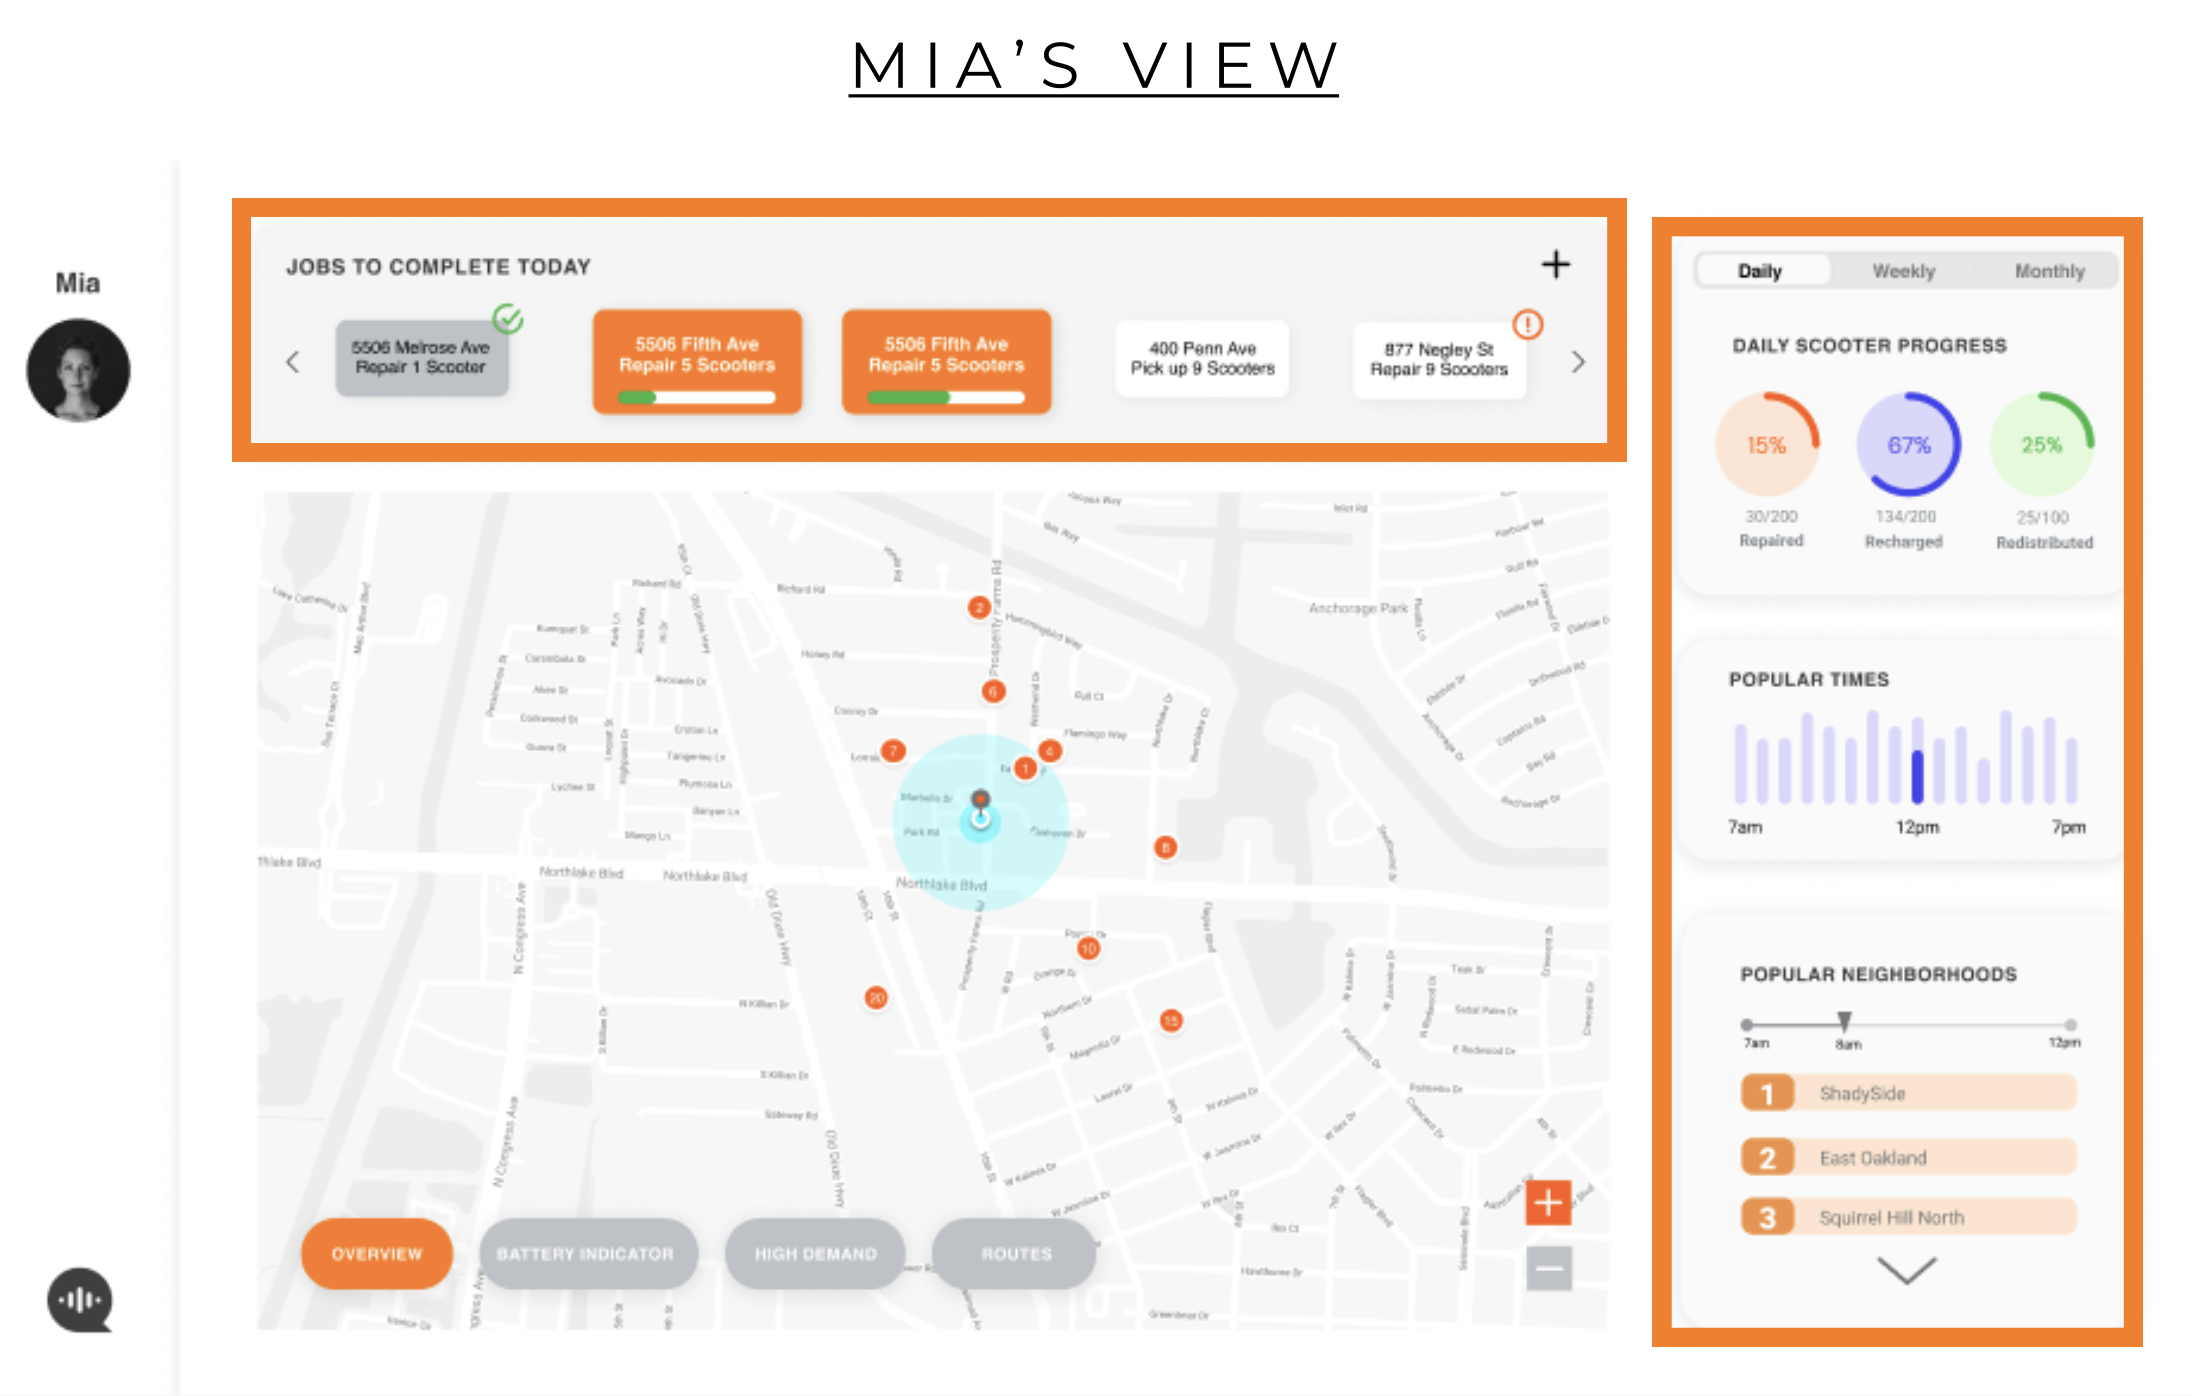
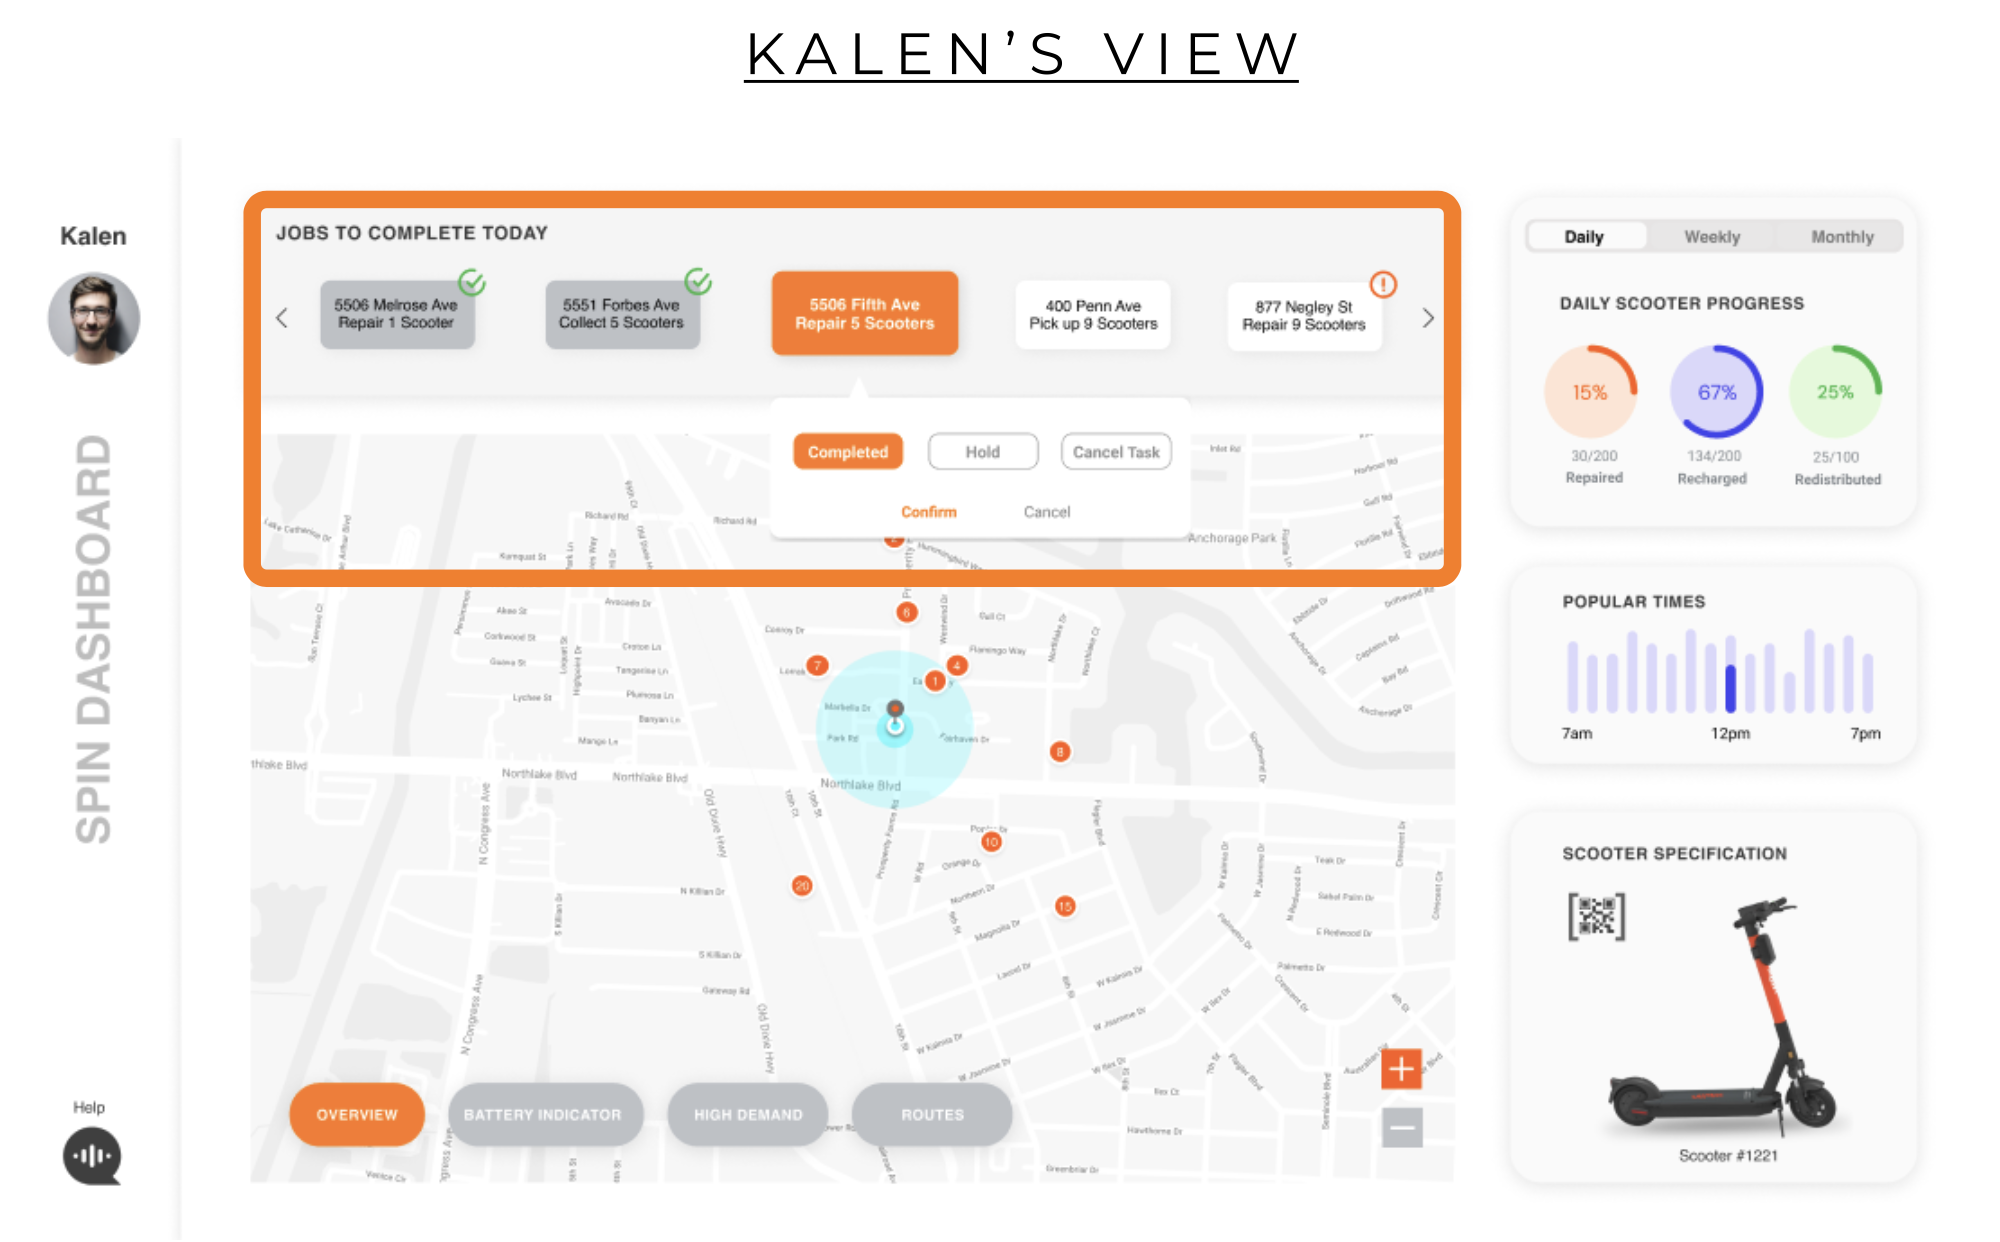
We located the task manager feature on the top, which would be heavily used by both personas. This feature shows the available tasks for Kalen and the progress of each task for Mia. Through sharing the status of tasks, Mia and Kalen can both stay on the same page throughout the scooter distribution process.
Four View Map
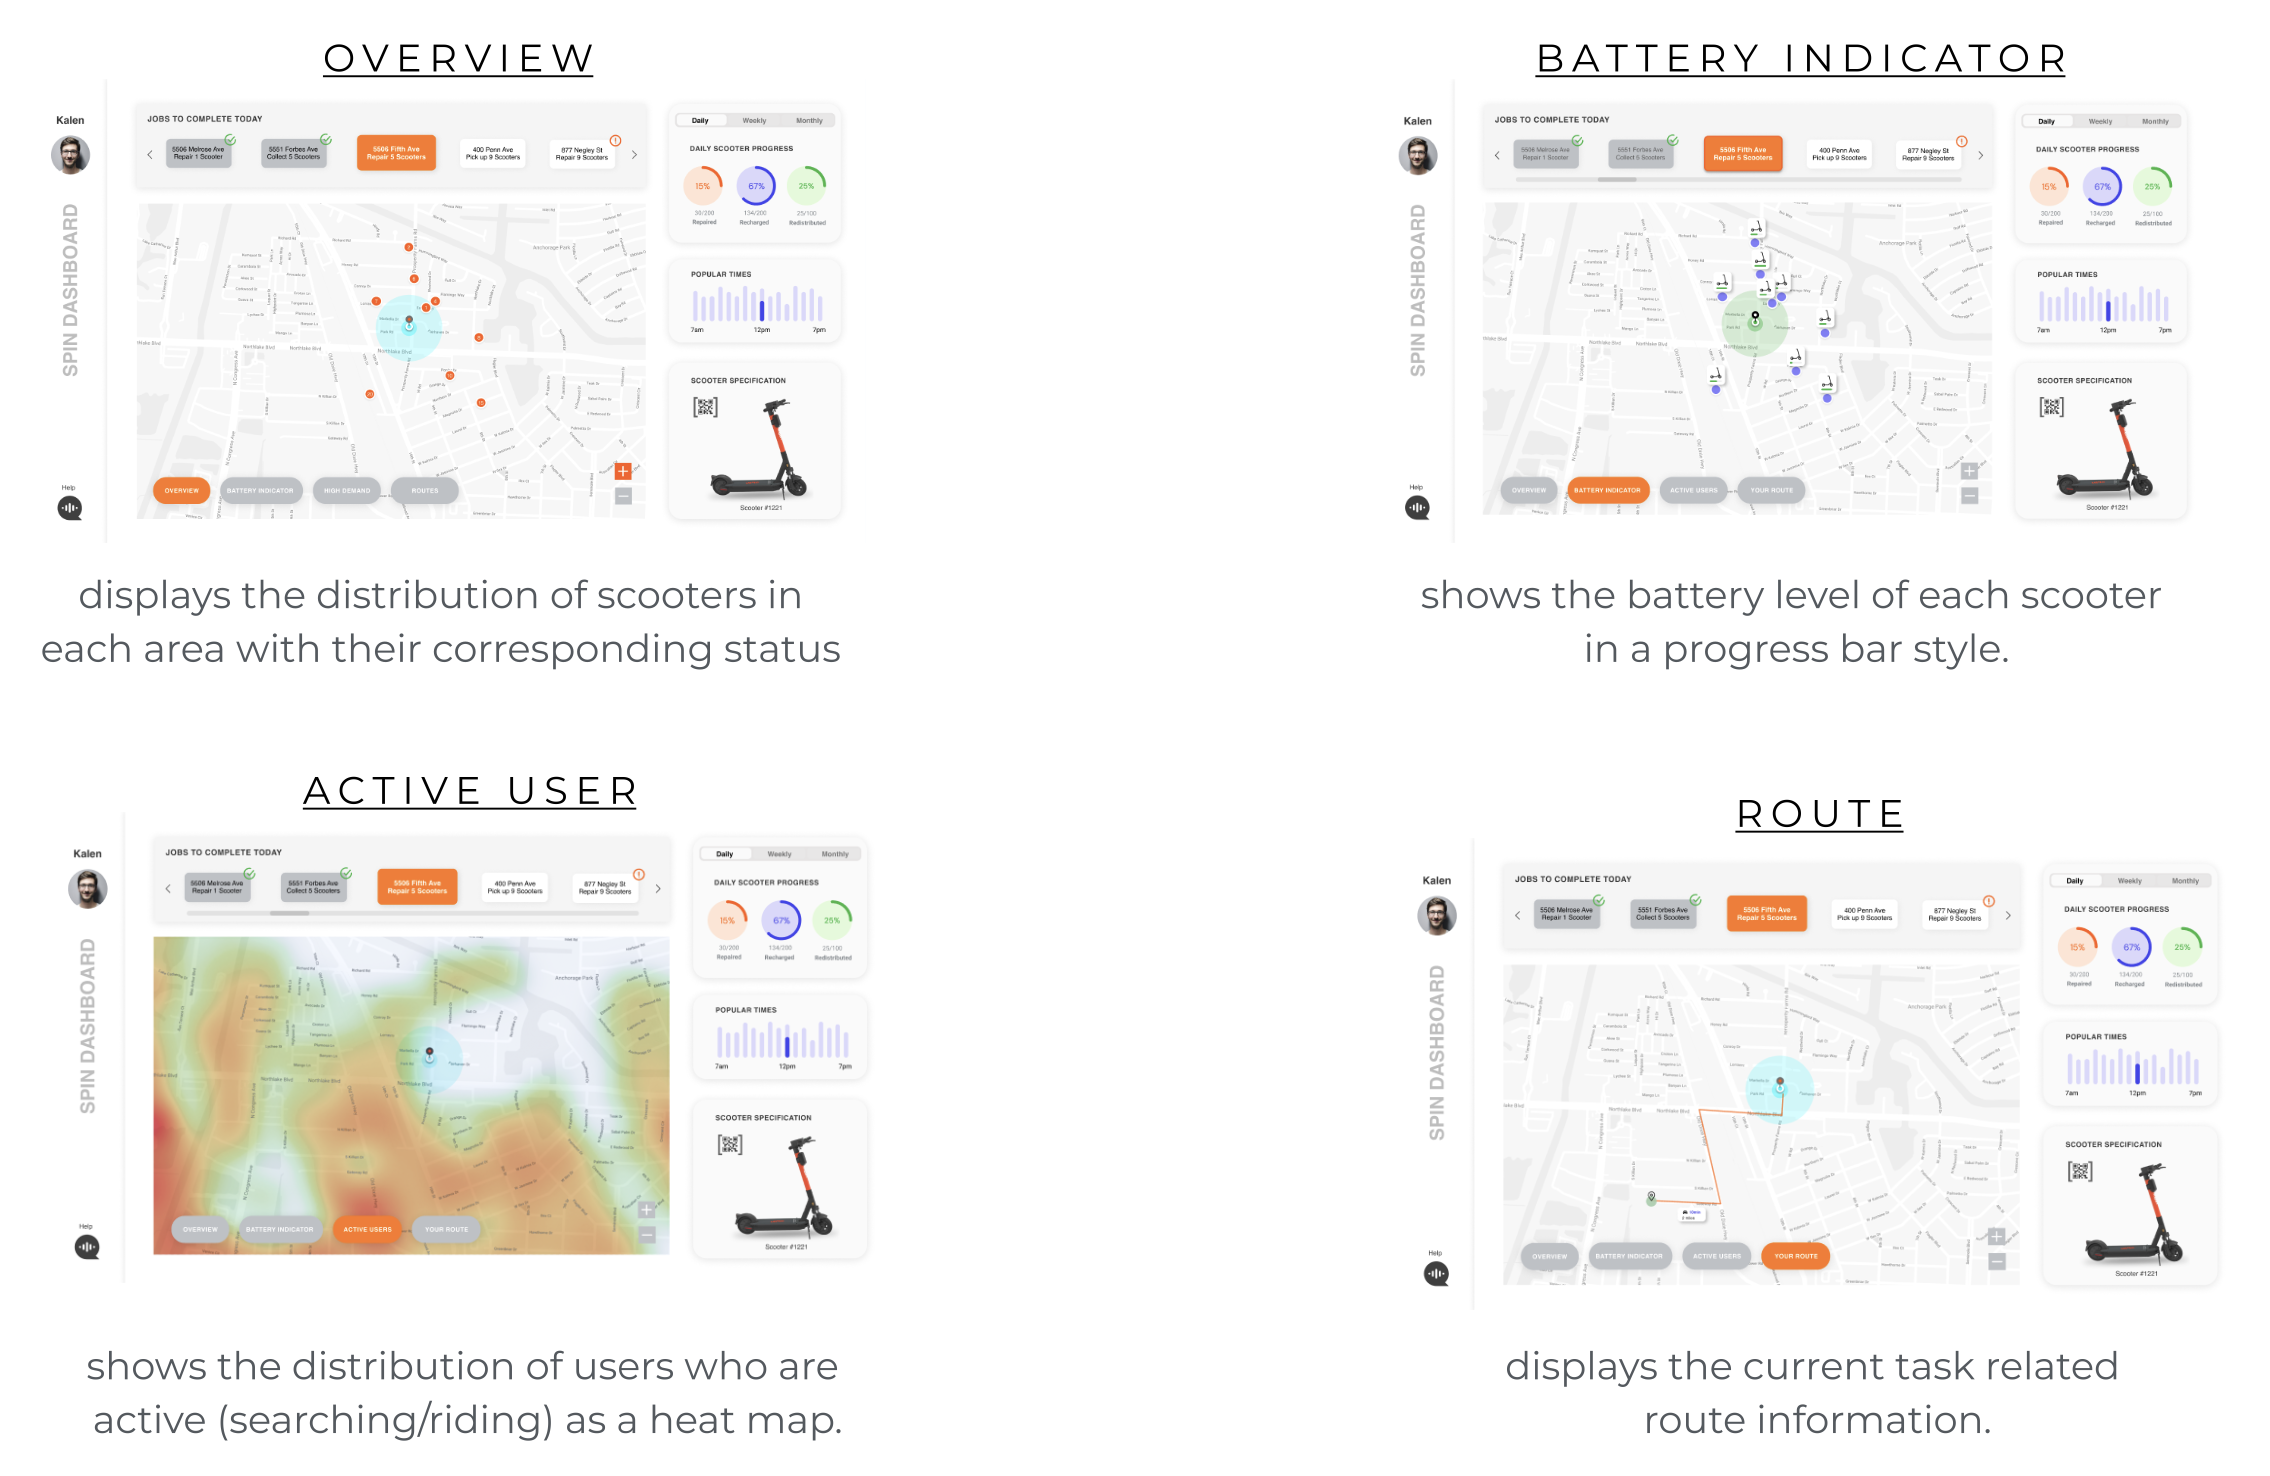
We all agree that overlaying location analysis on a map keeps data visualization simple. The map feature is divided into four categories : Overview, Battery Indicator, High Demand (Active User), and Route. These four views are designed to be overlayed on the same map to maintain the design layout consistency while maximizing the usage of the dashboard space.
Task Manager
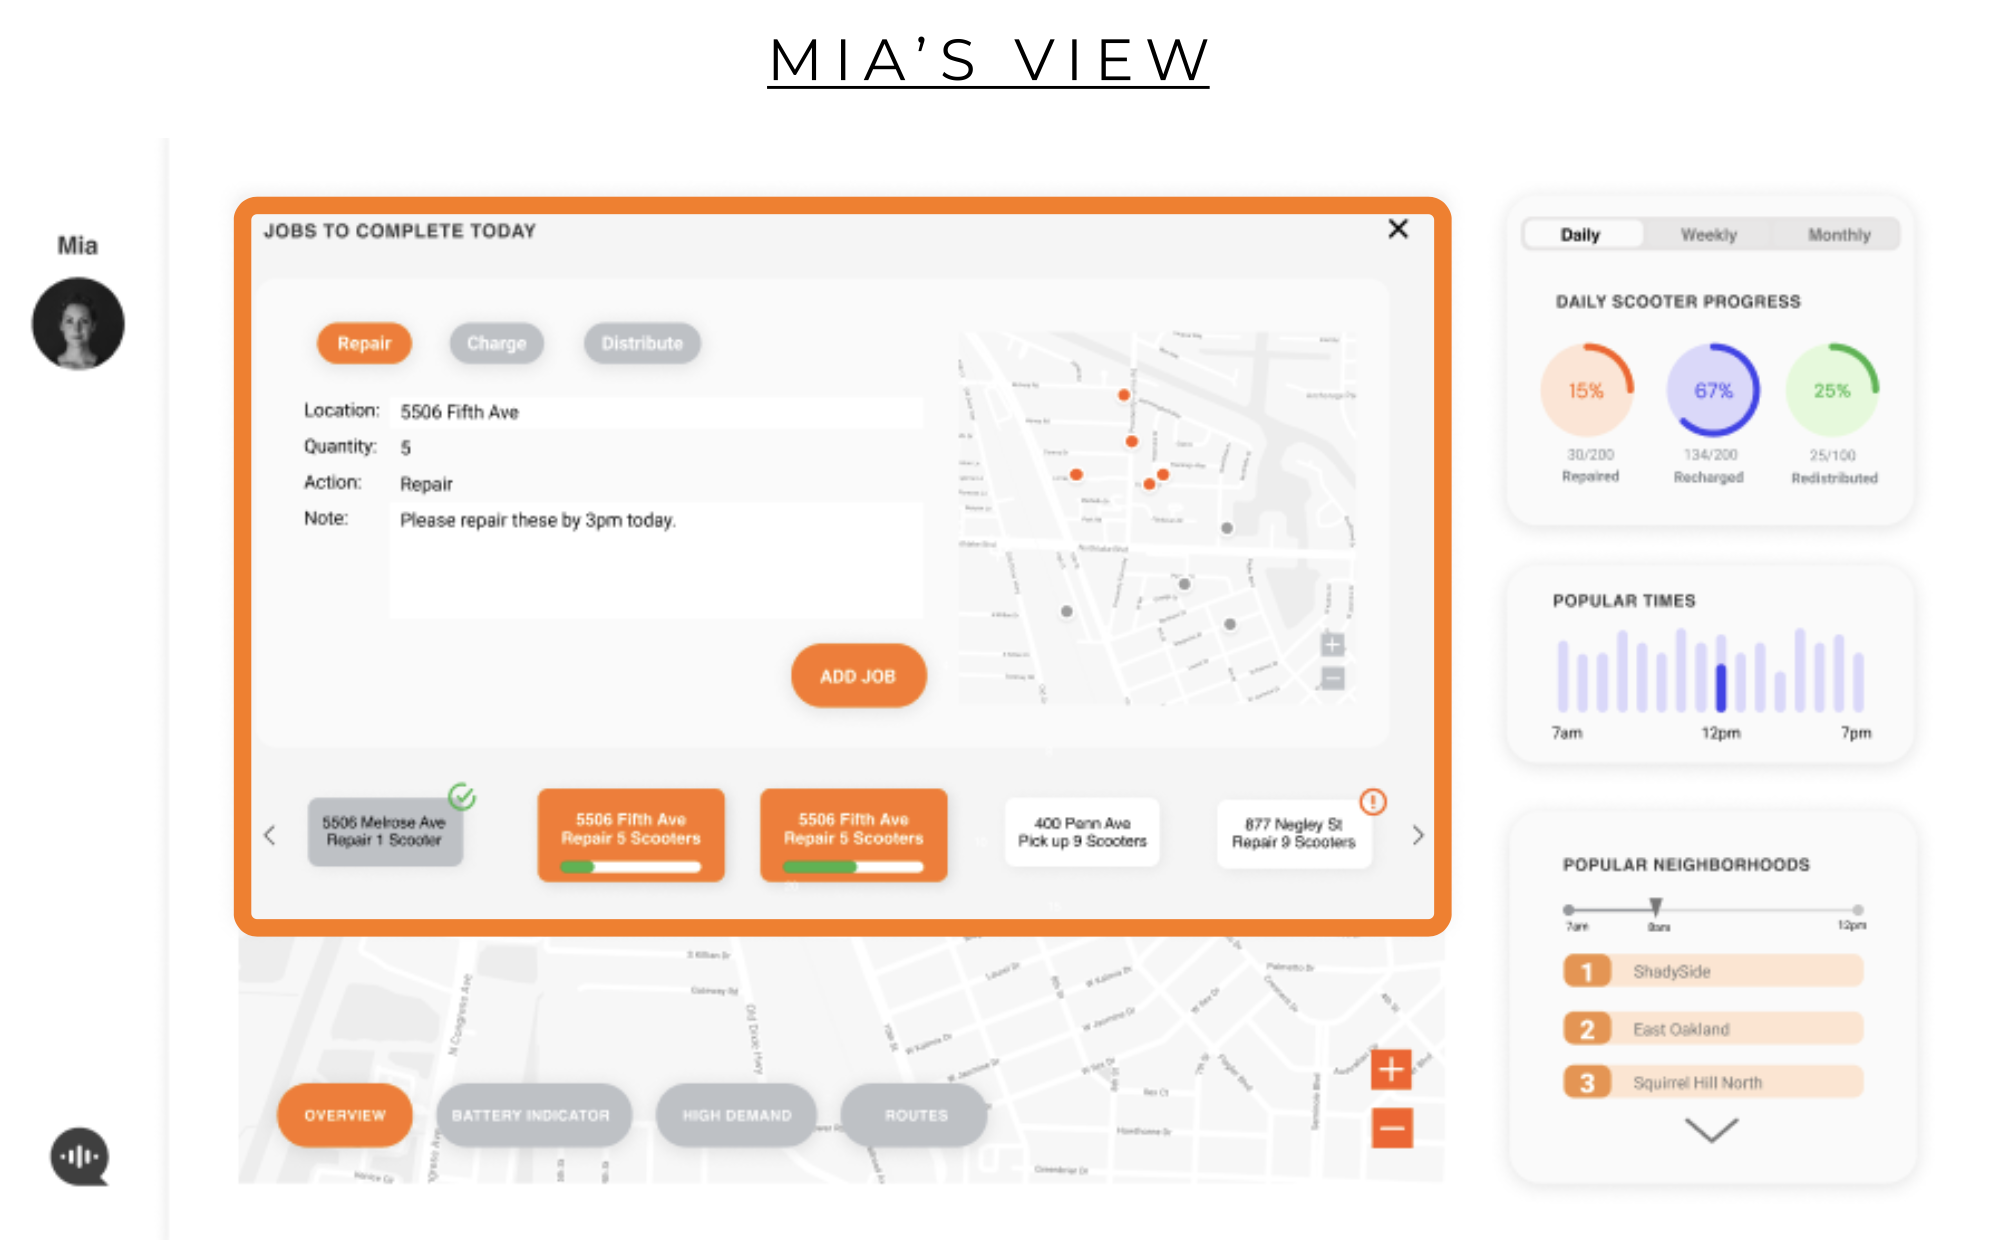
Interacting with the same element suggests a level of communication. Through the same task manager feature, both Mia and Kalen can update the tasks based on real-time data. As a data analyst, Mia can assign tasks with the respective location and job based on the scooter distribution data across the neighborhoods.
For instance, if she finds that Shadyside has no scooters available at the moment, she can input a new task to deliver recharged scooters to this area. Following the tasks posted, Kalen can then look through the job list to select and compelte the tasks that fit well with his route and schedule. This process allows Kalen to have his own flexible schedule to complete as many tasks as possible while looking for a full-time job, which are two of his goals.
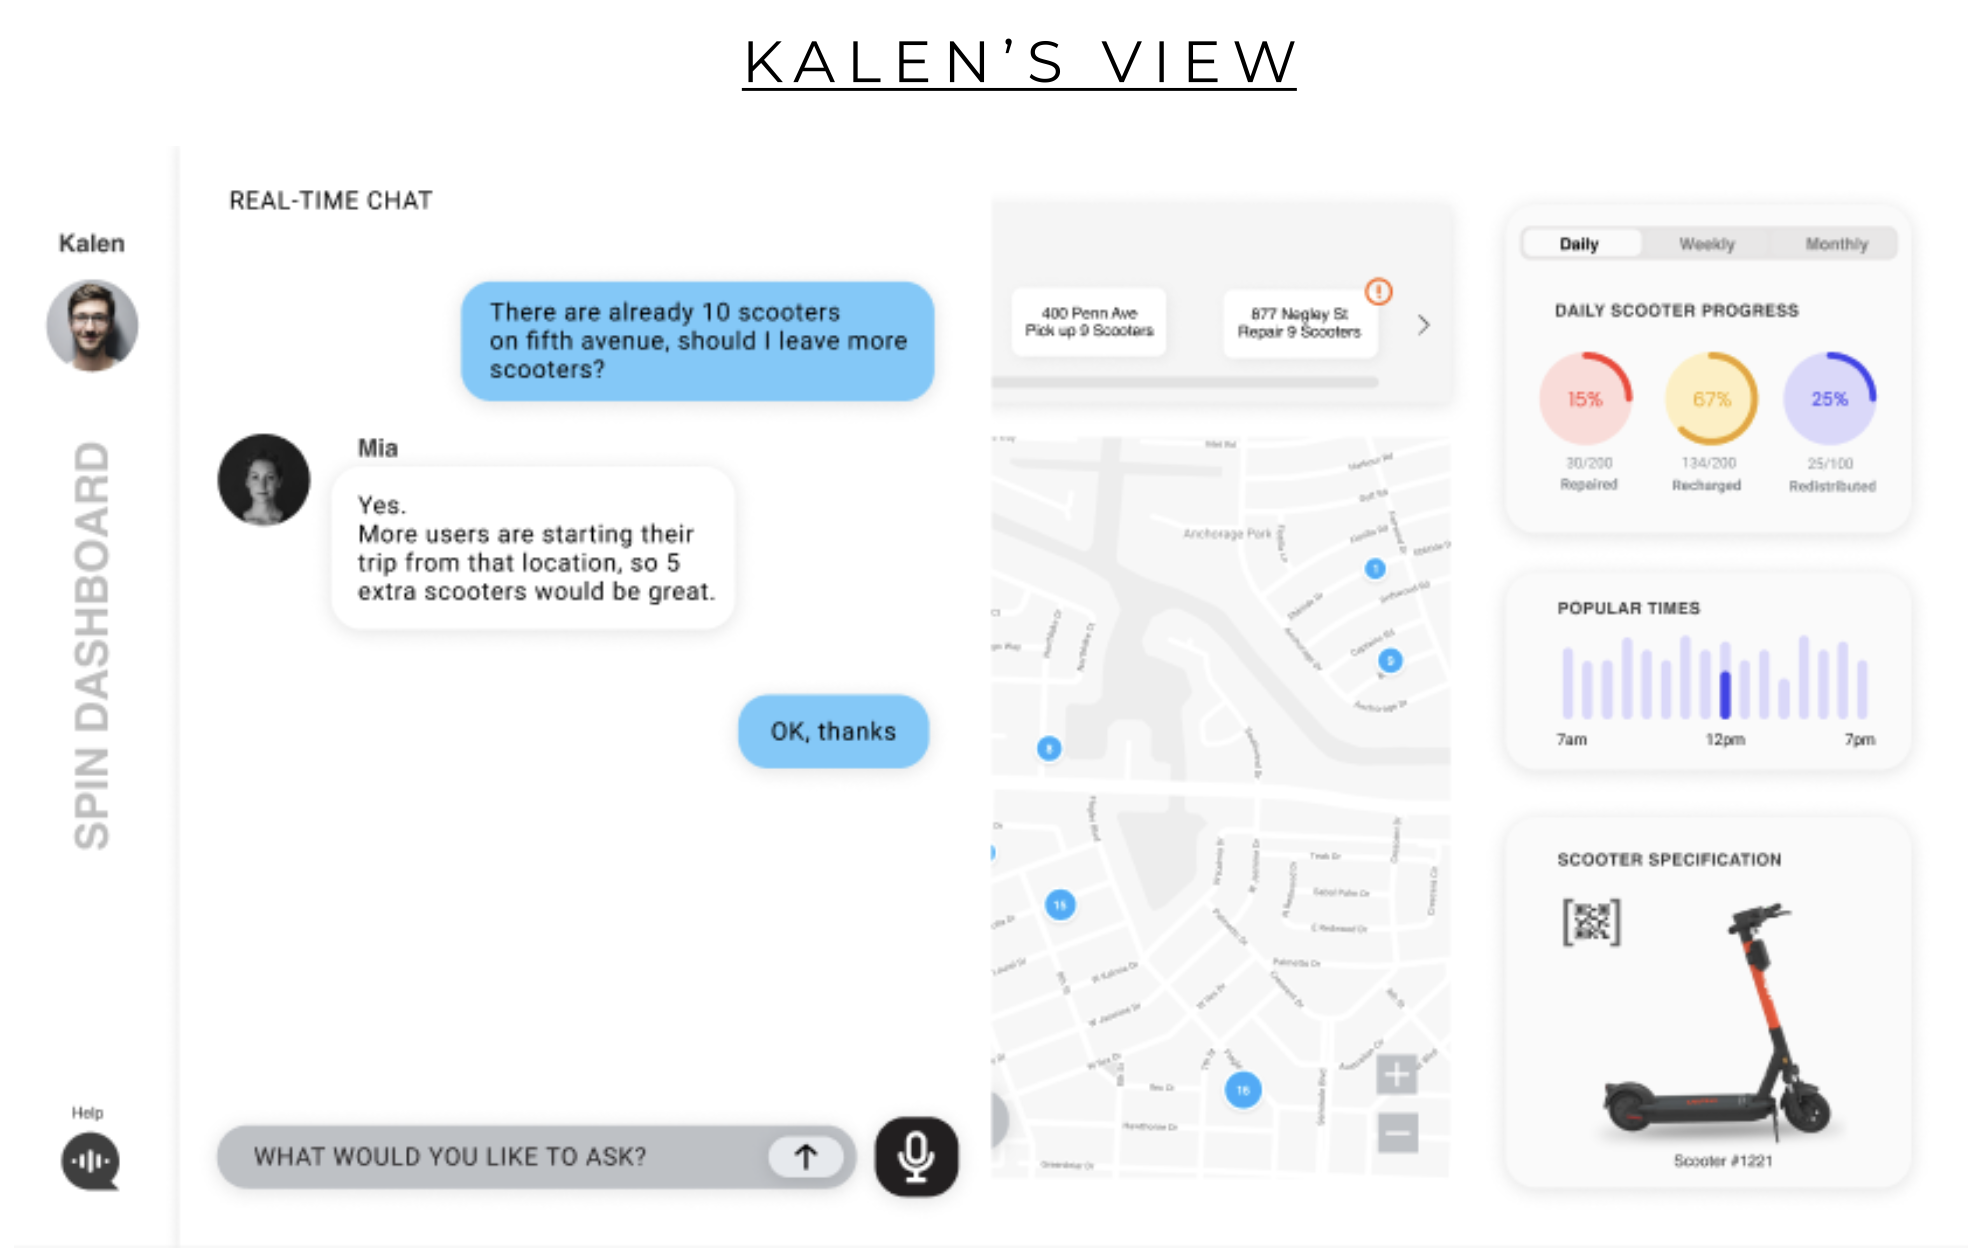
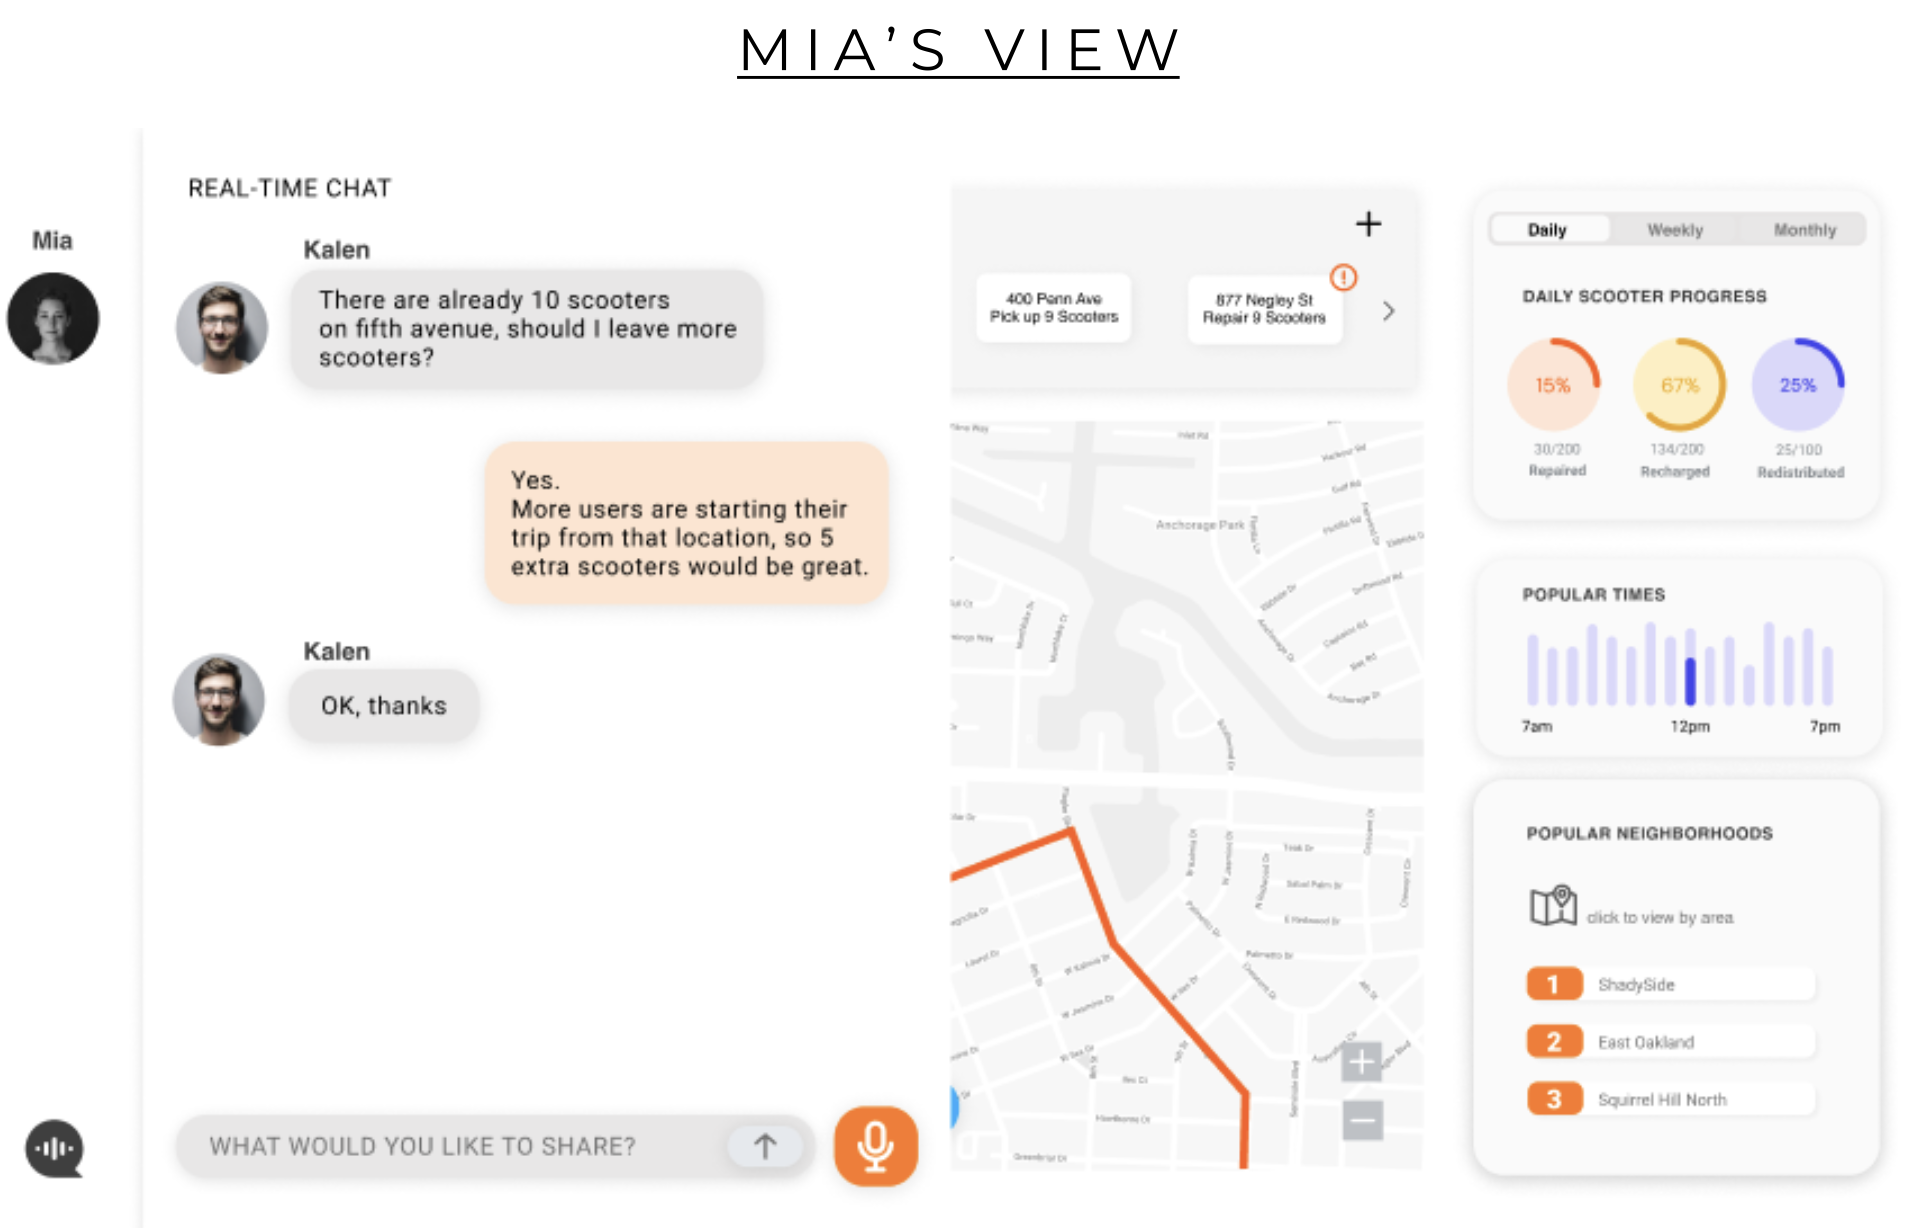
Real-time Q&A
The best communication would be direct conversation among the users. Hence, this instant chat feature enables a smooth two-way communication for our users. The users can either type or speak to communicate with each other in real-time.
We included two input methods (type & speech) because for Mia who's working on a desktop environment at an office, typing would be much easier to communicate. On the other hand, for Kalen who's on the road driving for the most of the time, speech recognition feature would come in handy for a safer drive.
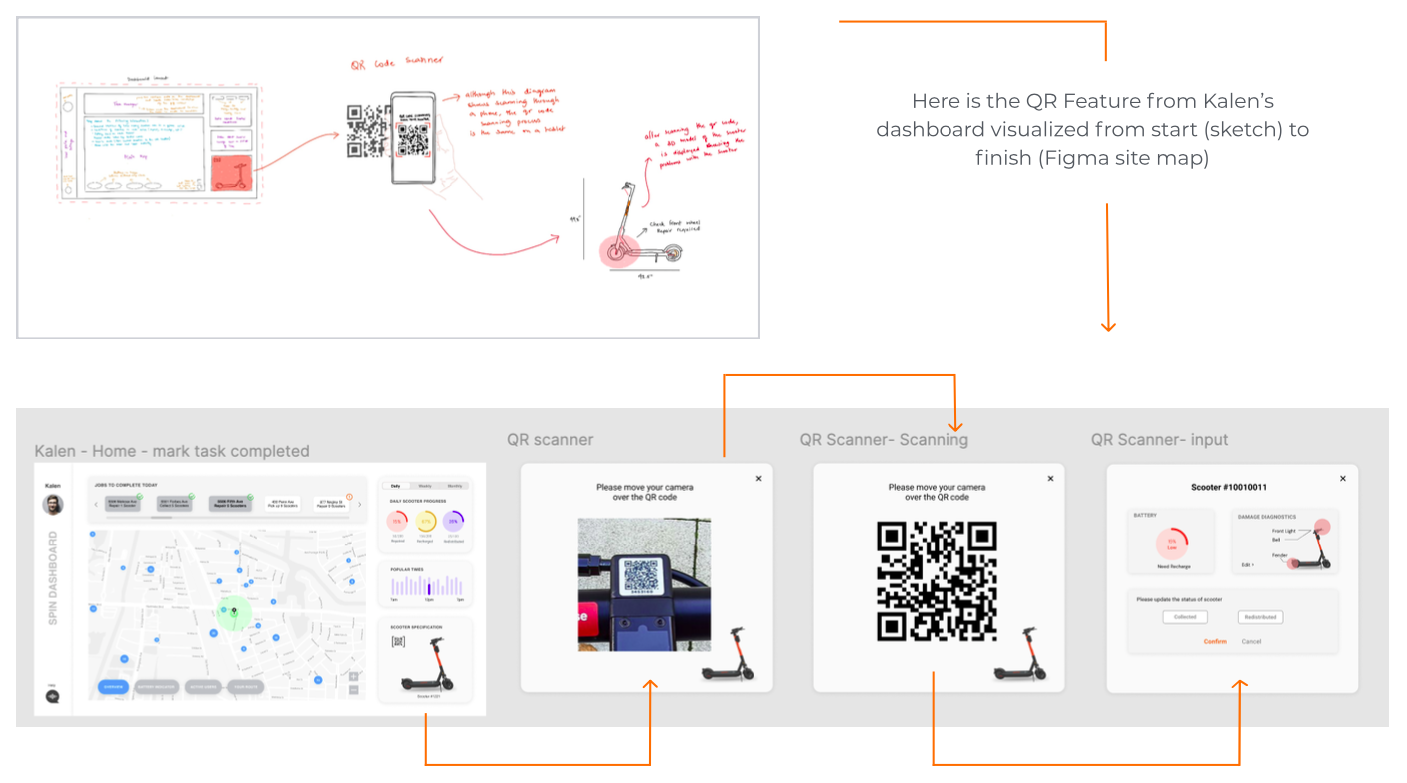
QR Code Scanner (for Gig Workers)
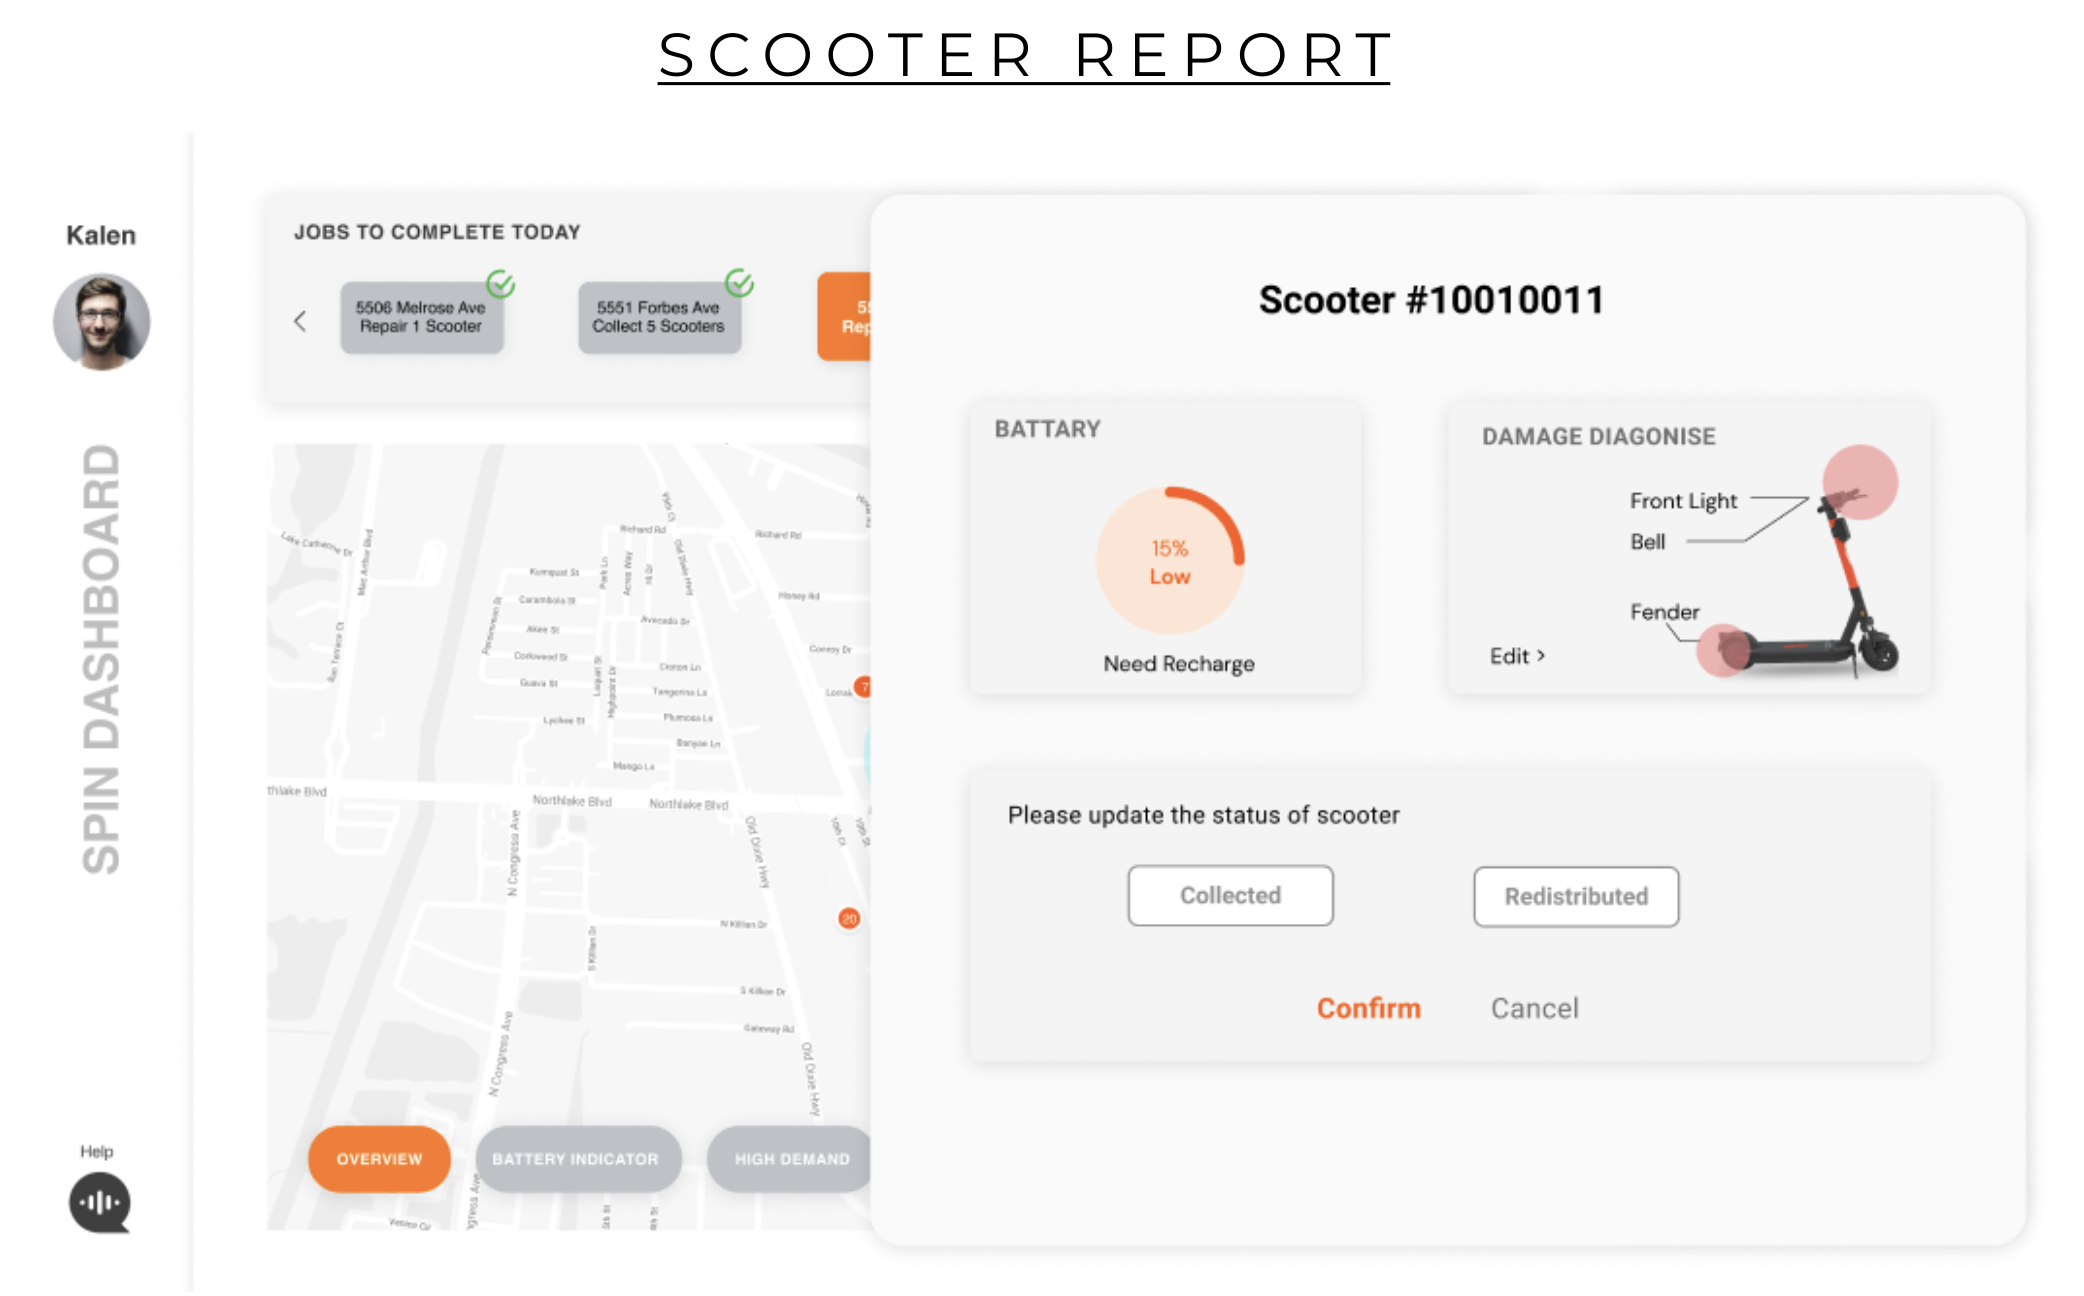
Understanding that the advanced technology can leverage work efficiency, we integrated QR code scanner feature into our dashboard so that Kalen can quickly diagnose the issue of the scooter if it's in need of a simple repair and update the scooter status. Upon scanning a scooter, this feature will display a rapid report of the scooter status based on the information stored in the scooter.
Motion Design
Designing for motion should not be an afterthought. We first sketched quick motion design ideas, then developed the ideas into high-fidelity Figma prototypes with hotspot interactions and AfterEffects motion design.
To better communicate our dashboard design user experience, we developed our envisioned feedforward and feedback that cannot be fulfilled using Figma using After Effects motion design. For instance, little text bubble indicator shows the scooter status upon clicking on a dot on the map. Another example would be the experience of scanning the actual scooter's QR code, which was animated using After Effects.
High-fidelity prototype
We conducted two user testing sessions with groups of four human-computer interaction college students to hear their opinions on our design. As fellow UI/UX designers, they provided various feedbacks such as color grouping and user input improvement.
Some of the points we changed after the user testing sessions are:
- Adjust color, iconography, and layout of the map overview feature for more intuitive and quick processing.
- Leverage the task management feature to improve user freedom and easier input.
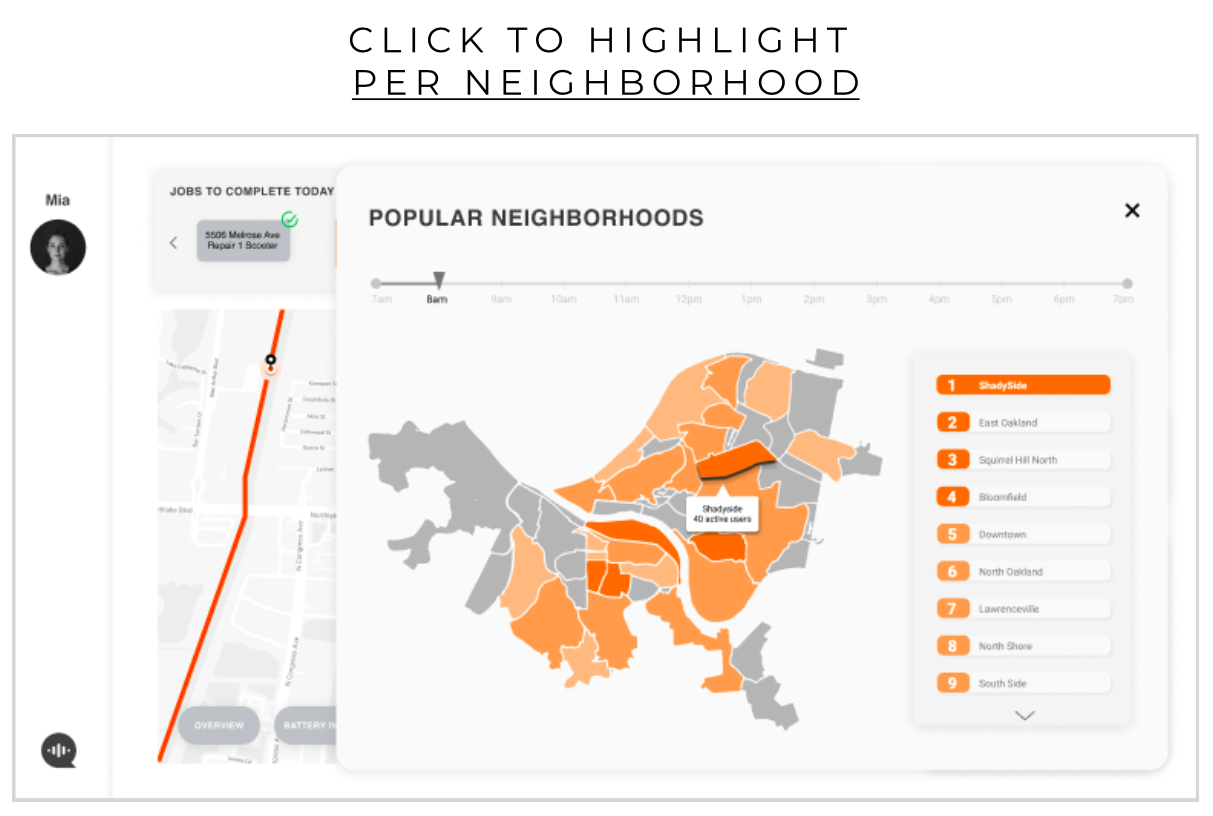
- Implement an additional feature called 'Popular Neighborhoods' for data analyst to quickly receive data visualizatios on ridership that can further be used to predict user usage trend and make advertising decisions.
With these in mind, we made the changes that address each points.
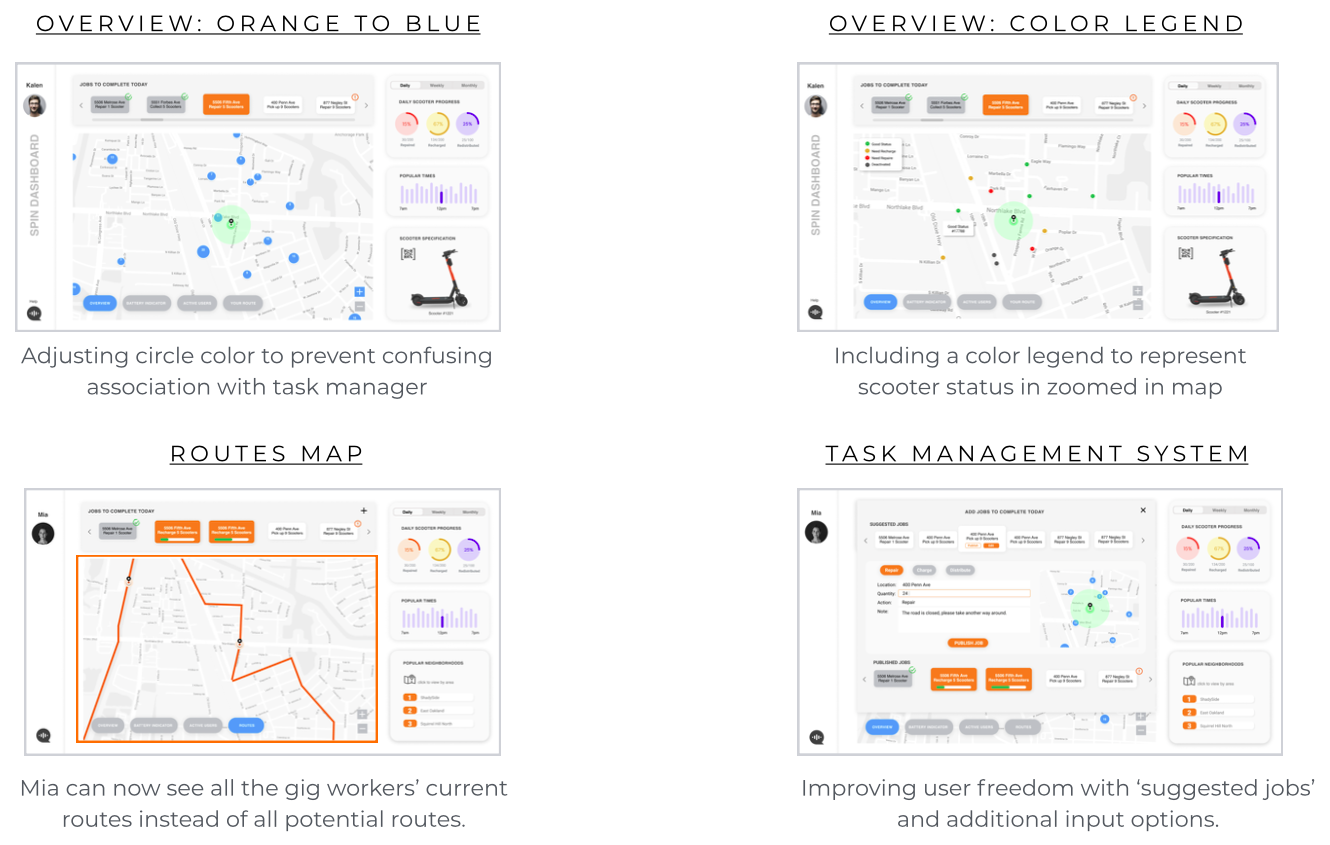
Four View Map
We adjusted colors for our final map feature, especially in the overview and route views.
Task Manager
Because the task manager is a key feature for asynchronous, task-based communication, we wanted to redesign the task manager for Mia and Kalen such that it allows greater user input freedom. Thus, we included automated task suggestion feature based on the available data for Mia and easy one-touch task status update for Kalen.
Popular Neighborhoods (for Data Analysts)
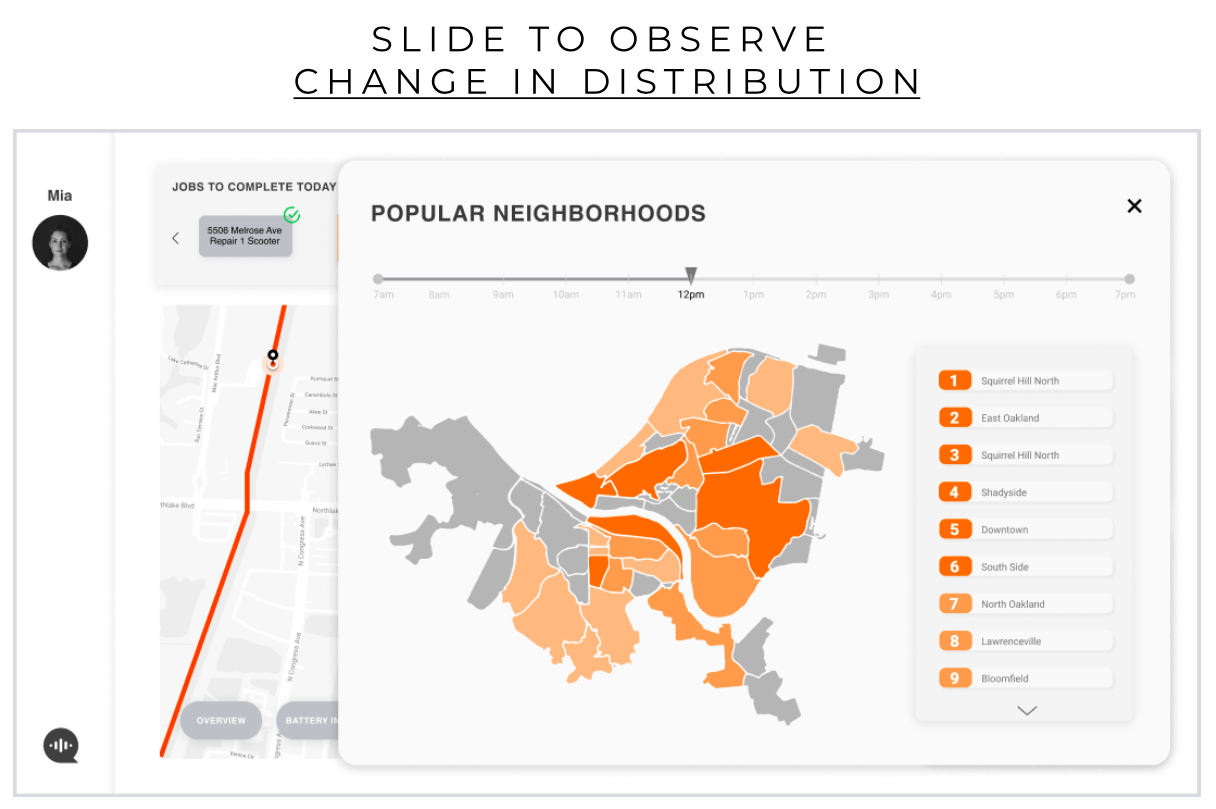
While the dashboards for Mia and Kalen share many similar overlapping features, one need of Mia that we felt it still hasn't been addressed was providing a broad, overarching map of the ridership variations in each neighboorhood throughout the day. Hence, we made an additional feature for Mia so that she can quickly view and analyze the scooter usage trends to predict scooter distribution and make informed decisions.
Interactive Prototype
Interact with our dashboard design here or below:
Kalen's (Gig Worker) View
Mia's (Data Analyst) View
Reflection & Takeaways
Through this dashboard design project, I learned how to think about users' needs by
connecting multiple stakeholders' needs and pain points. This was also my first time designing as a group, which allowed fruitful conversations among the team regarding the design elements. Although we divided responsibility by features, we also
collectively helped each other in developing the design throughout the process and ensured that everyone was on the same page in each iteration.
Checking in with the team at the start of each iteration made our process much easier and spend the limited time we were allocated more productive.
In terms of design skills, I learned so much in making more careful decisions on the usage of colors as well as feedback, feedforward, and affordance for the dashboard interface controls.
Through the motion design, I was able to identify a number of constraints in motion and interactivity on Figma with my team and embrace new methods of designing such as integrating After Effects animation in the demo video.
During the pitch presentation, we received a suggestion that perhaps a feature that allows gig workers to communicate amongst themselves may benefit in organizing and distributing the tasks. With more time, I'd like to further develop such feature with our team to enhance the communication among and across our target user groups, which would further contribute to the productivity of the Spin Scooters' employees.